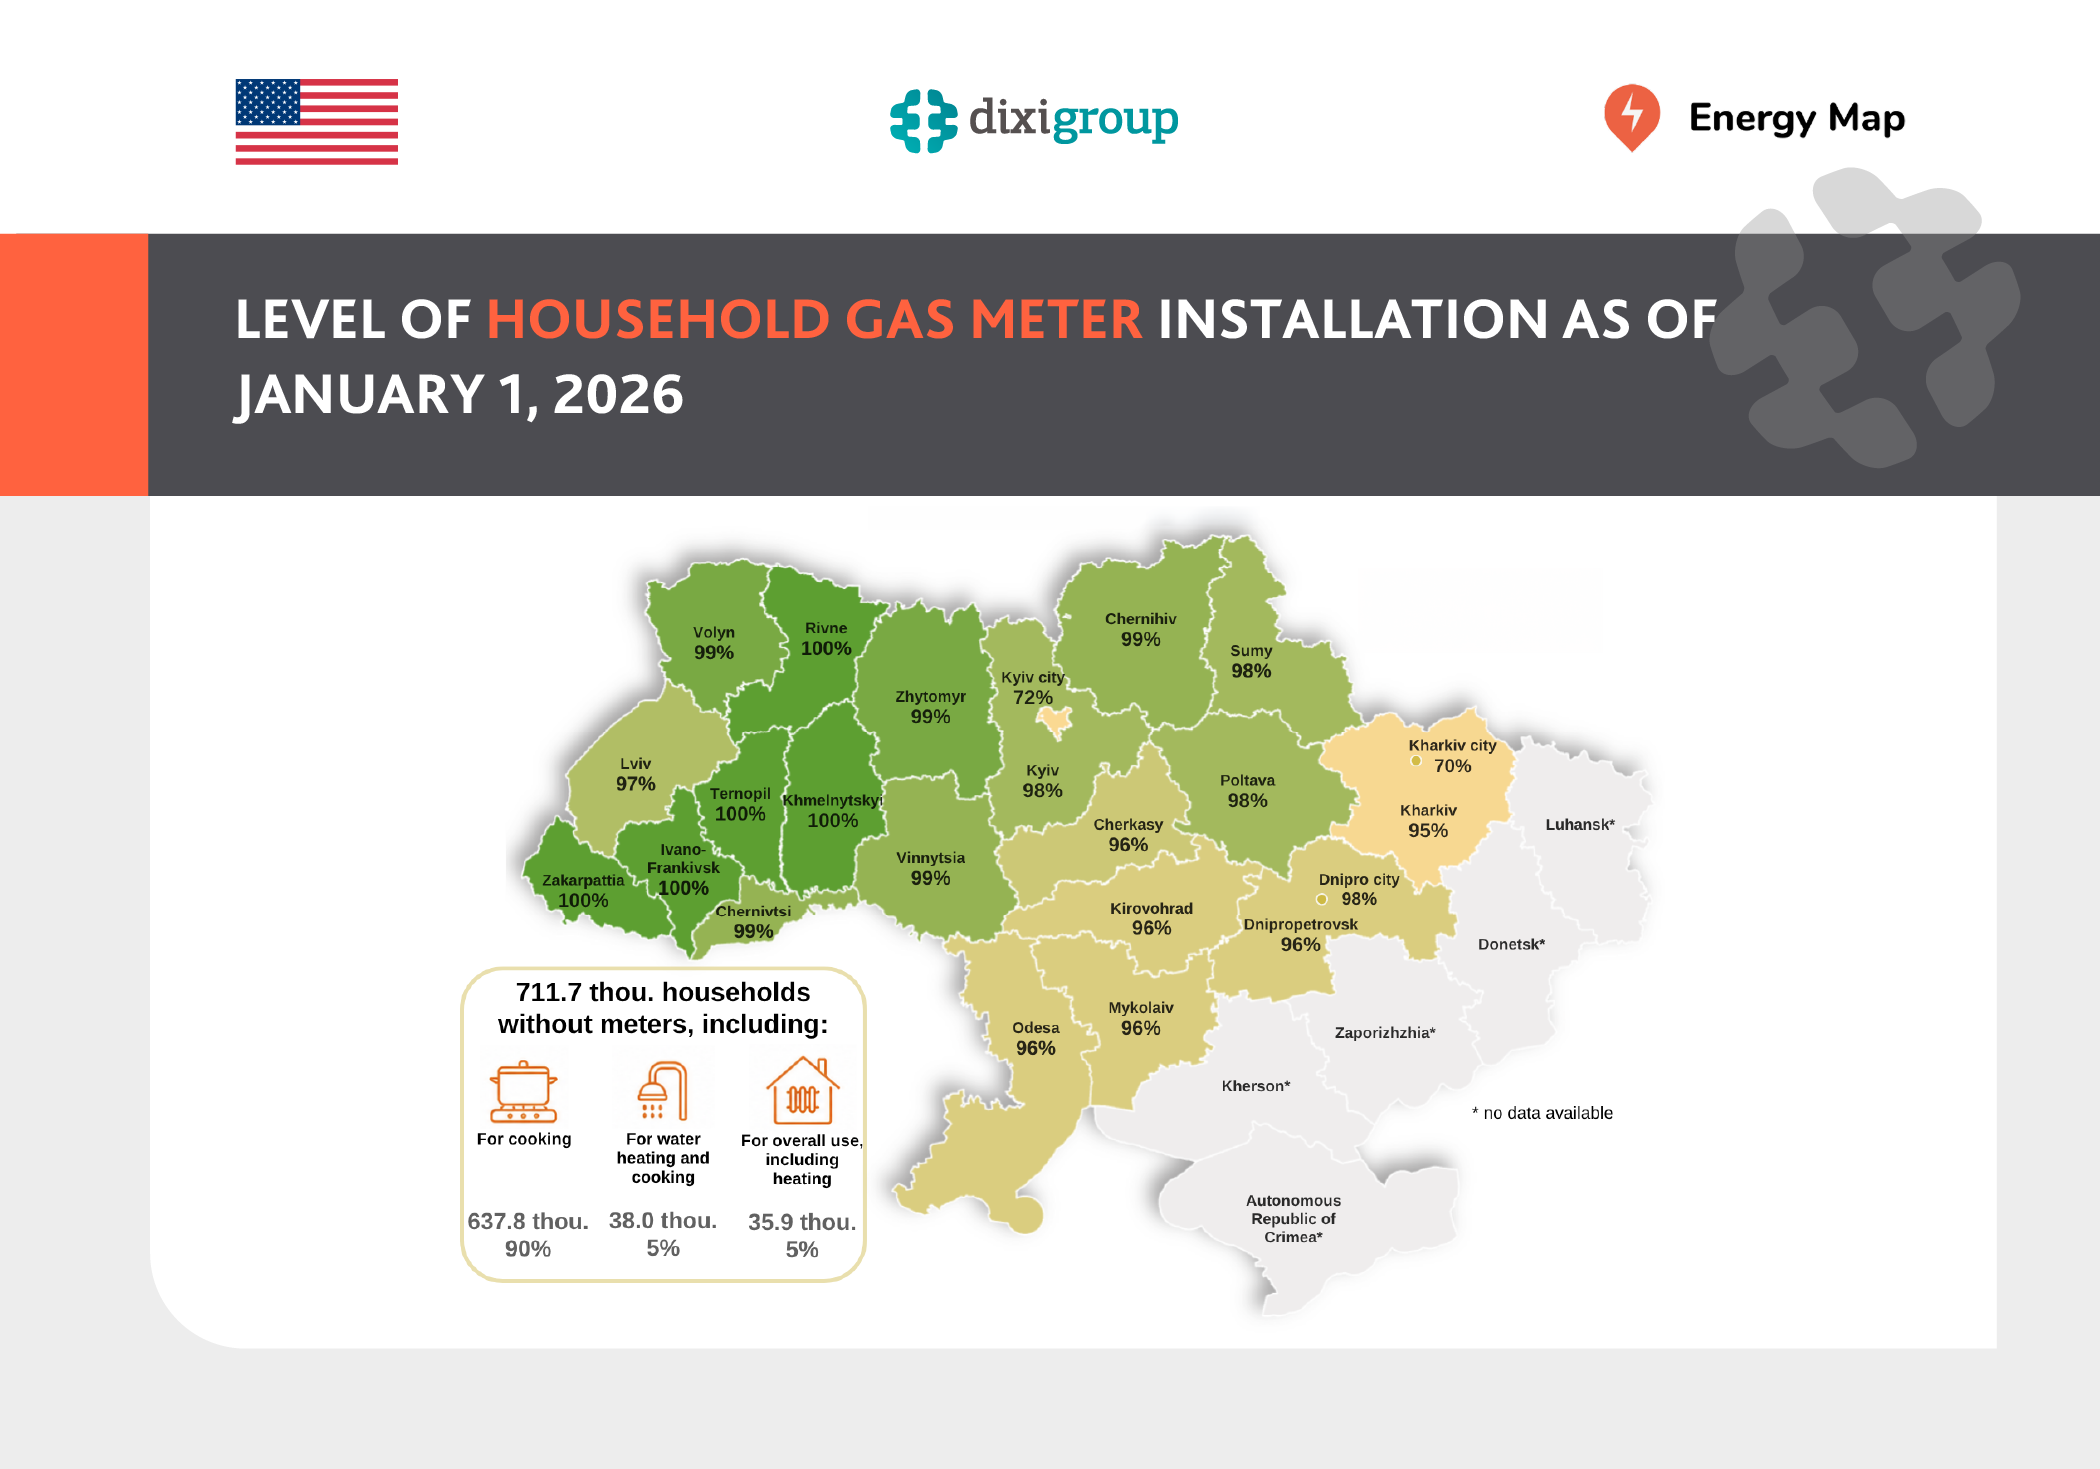
Data from the National Energy and Utilities Regulatory Commission (NEURC), published on the Energy Map portal, indicate that the process of equipping household natural gas consumers with commercial metering devices in Ukraine is approaching completion. As of 1 January 2026, most regions report metering coverage in the range of 98-100%, while the bulk of consumers […]
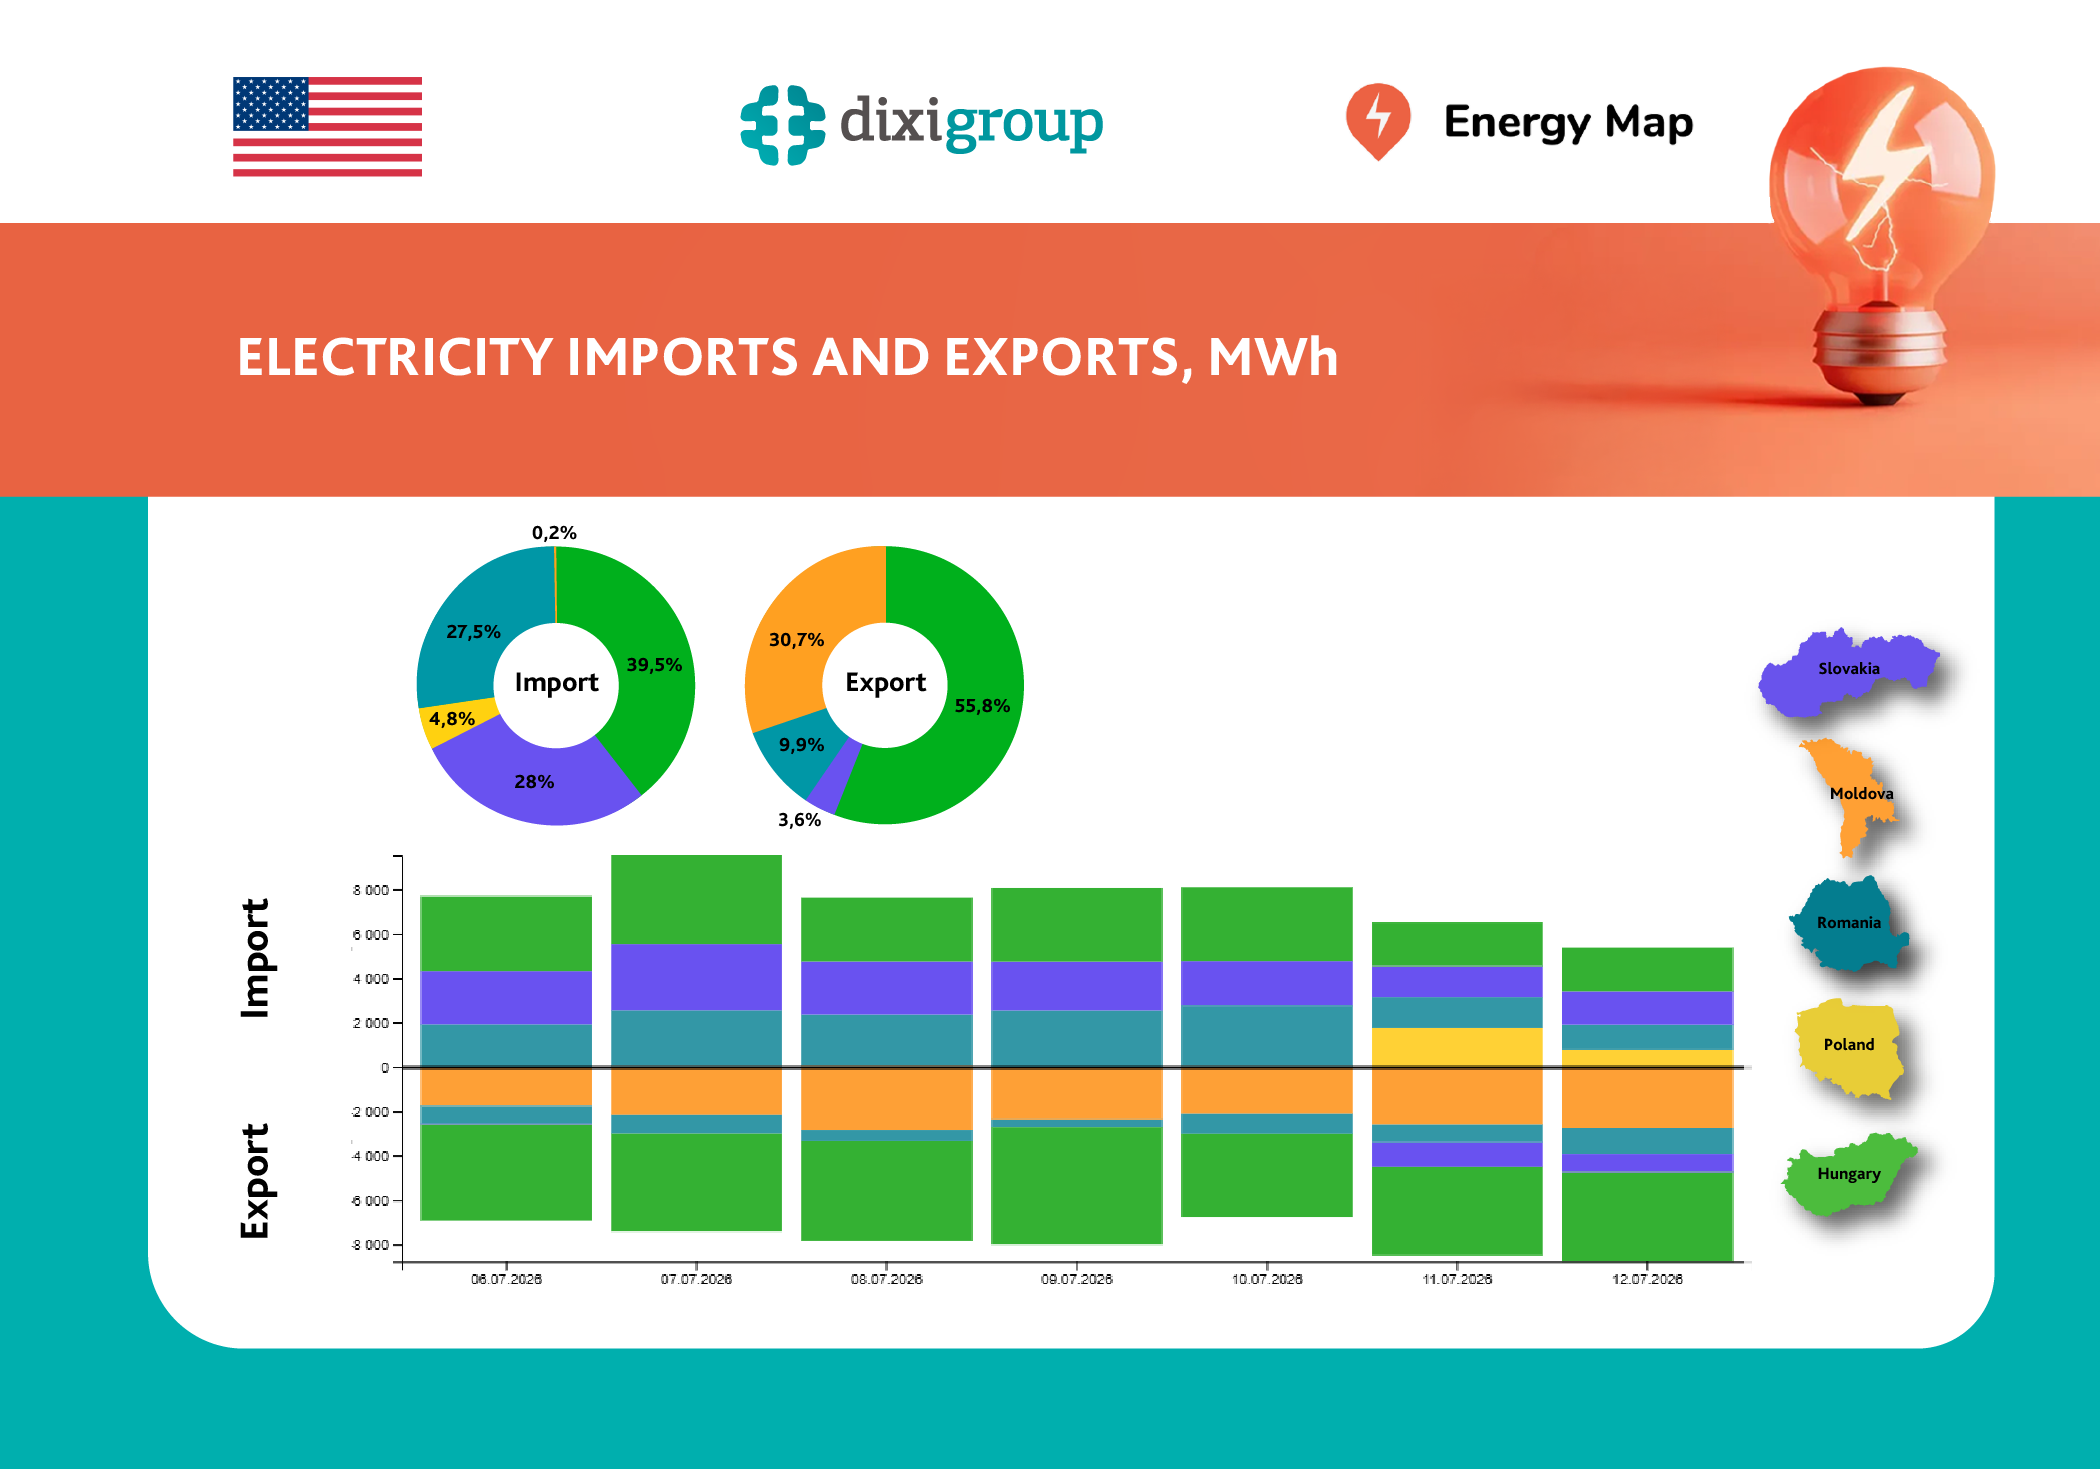
According to Energy Map data, electricity imports to Ukraine fell by 18.1% week-on-week to 52.9 GWh during the period of July 6-12. Meanwhile, exports rose by 75.5% to 54.3 GWh. As a result, Ukraine ended the week as a net electricity exporter, with exports exceeding imports by 1.4 GWh (or 2.5%). Despite continued Russian attacks on […]
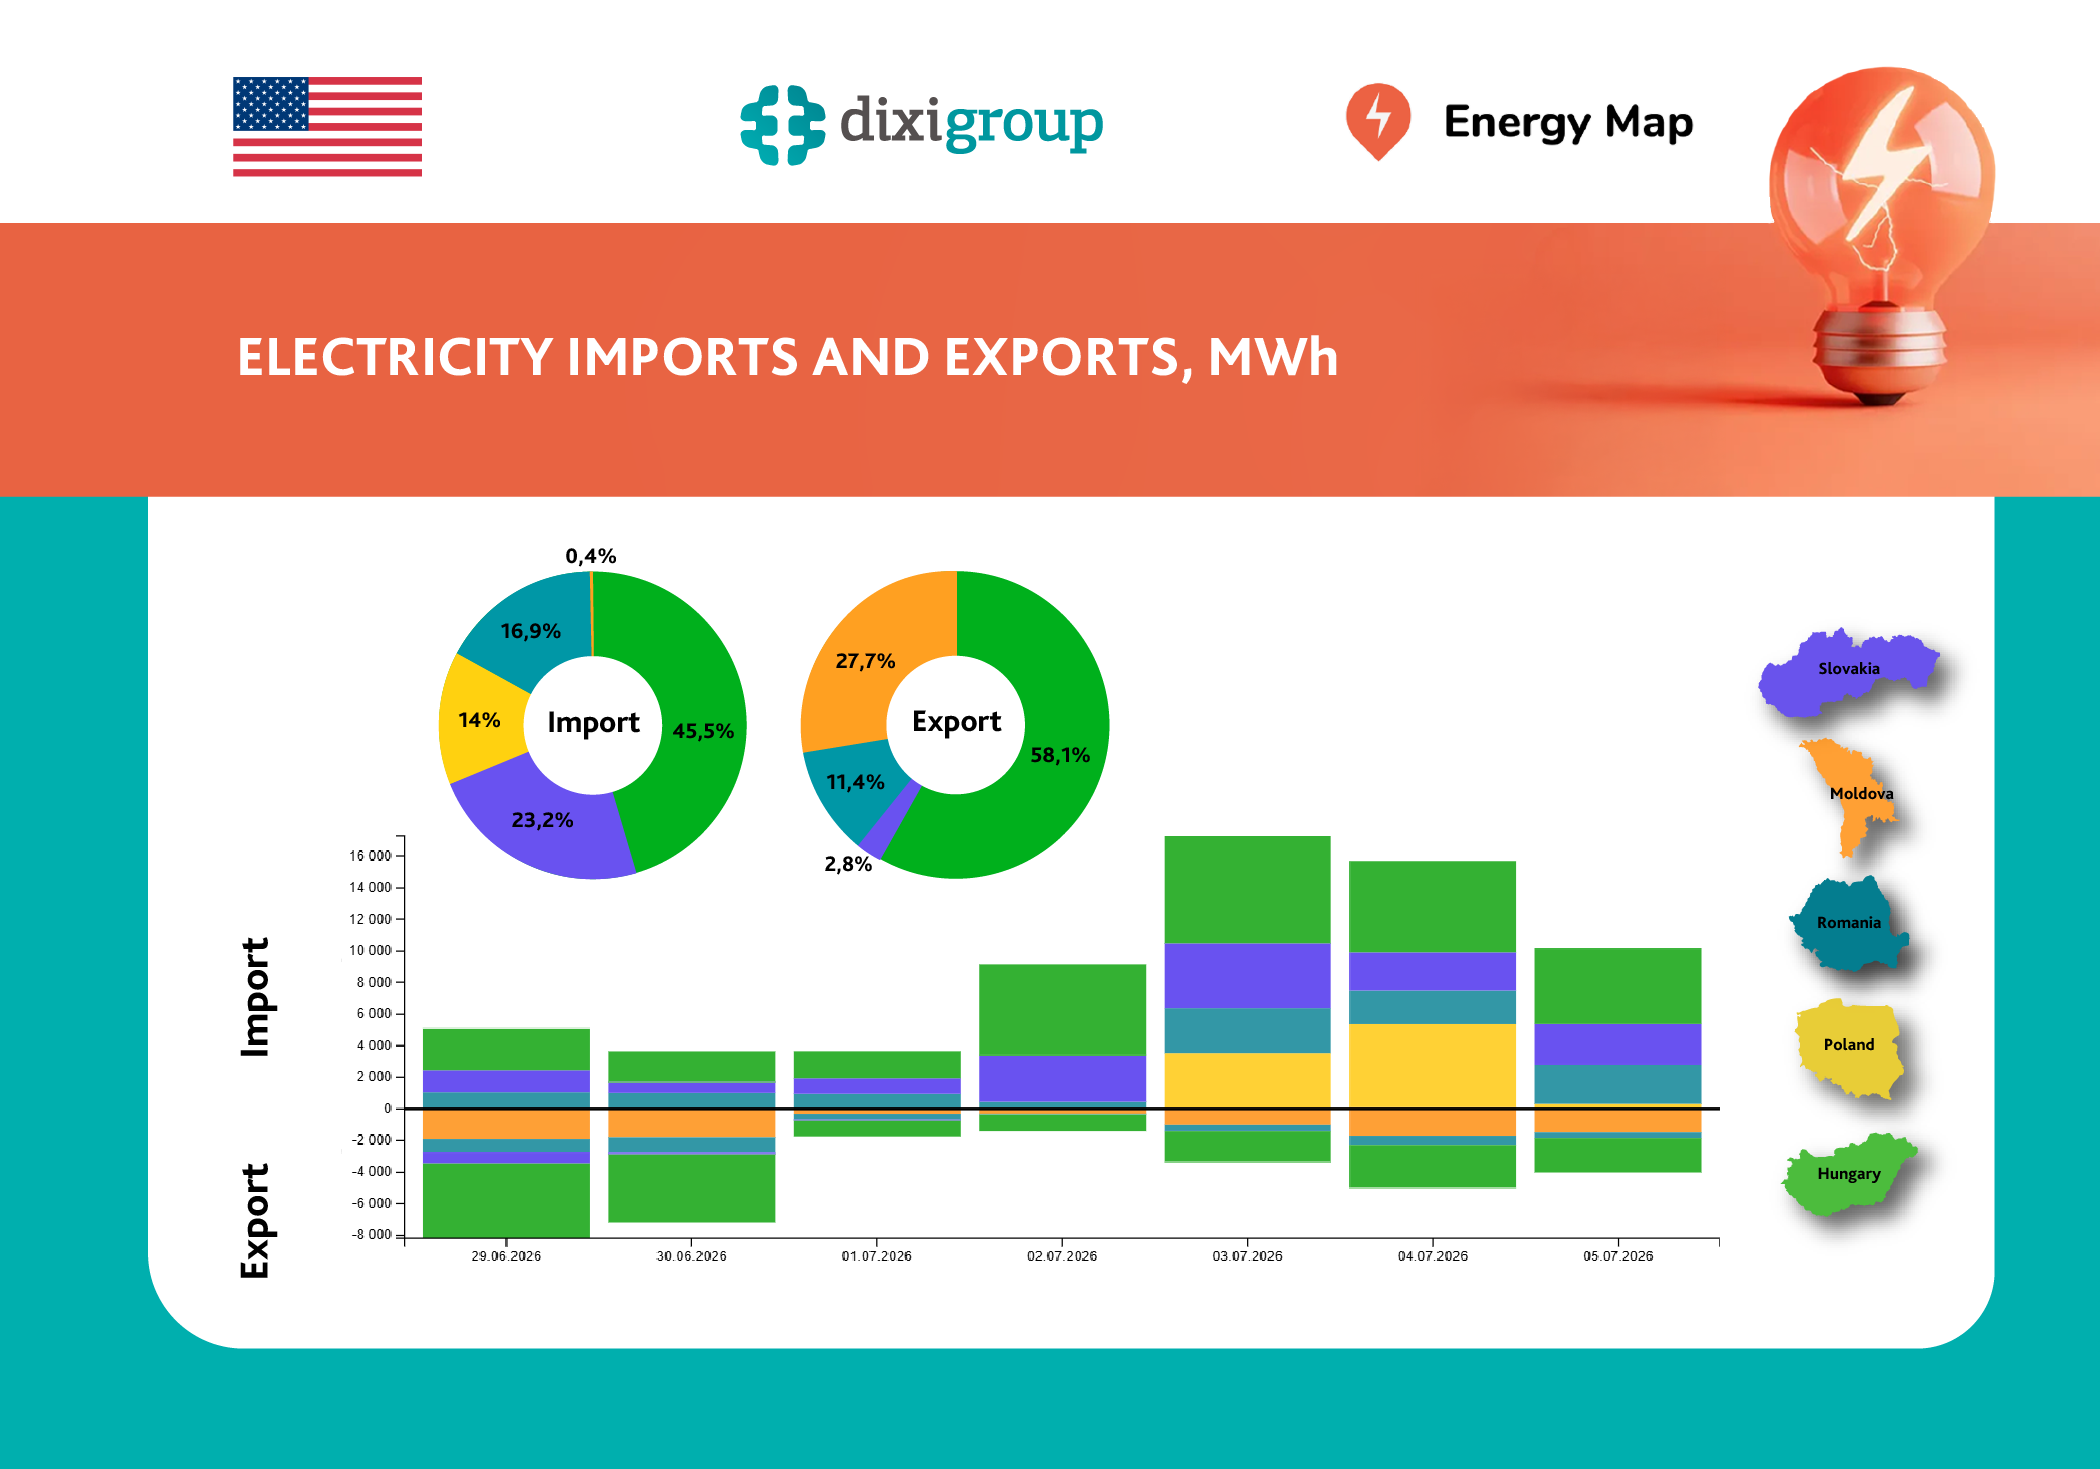
According to Energy Map data, electricity imports to Ukraine increased by 37% during the period from 29 June to 5 July compared to the previous week, reaching 64.6 GWh. At the same time, electricity exports declined by 38%, totaling 30.9 GWh. The increase in electricity consumption during the week was primarily driven by hot weather, which […]
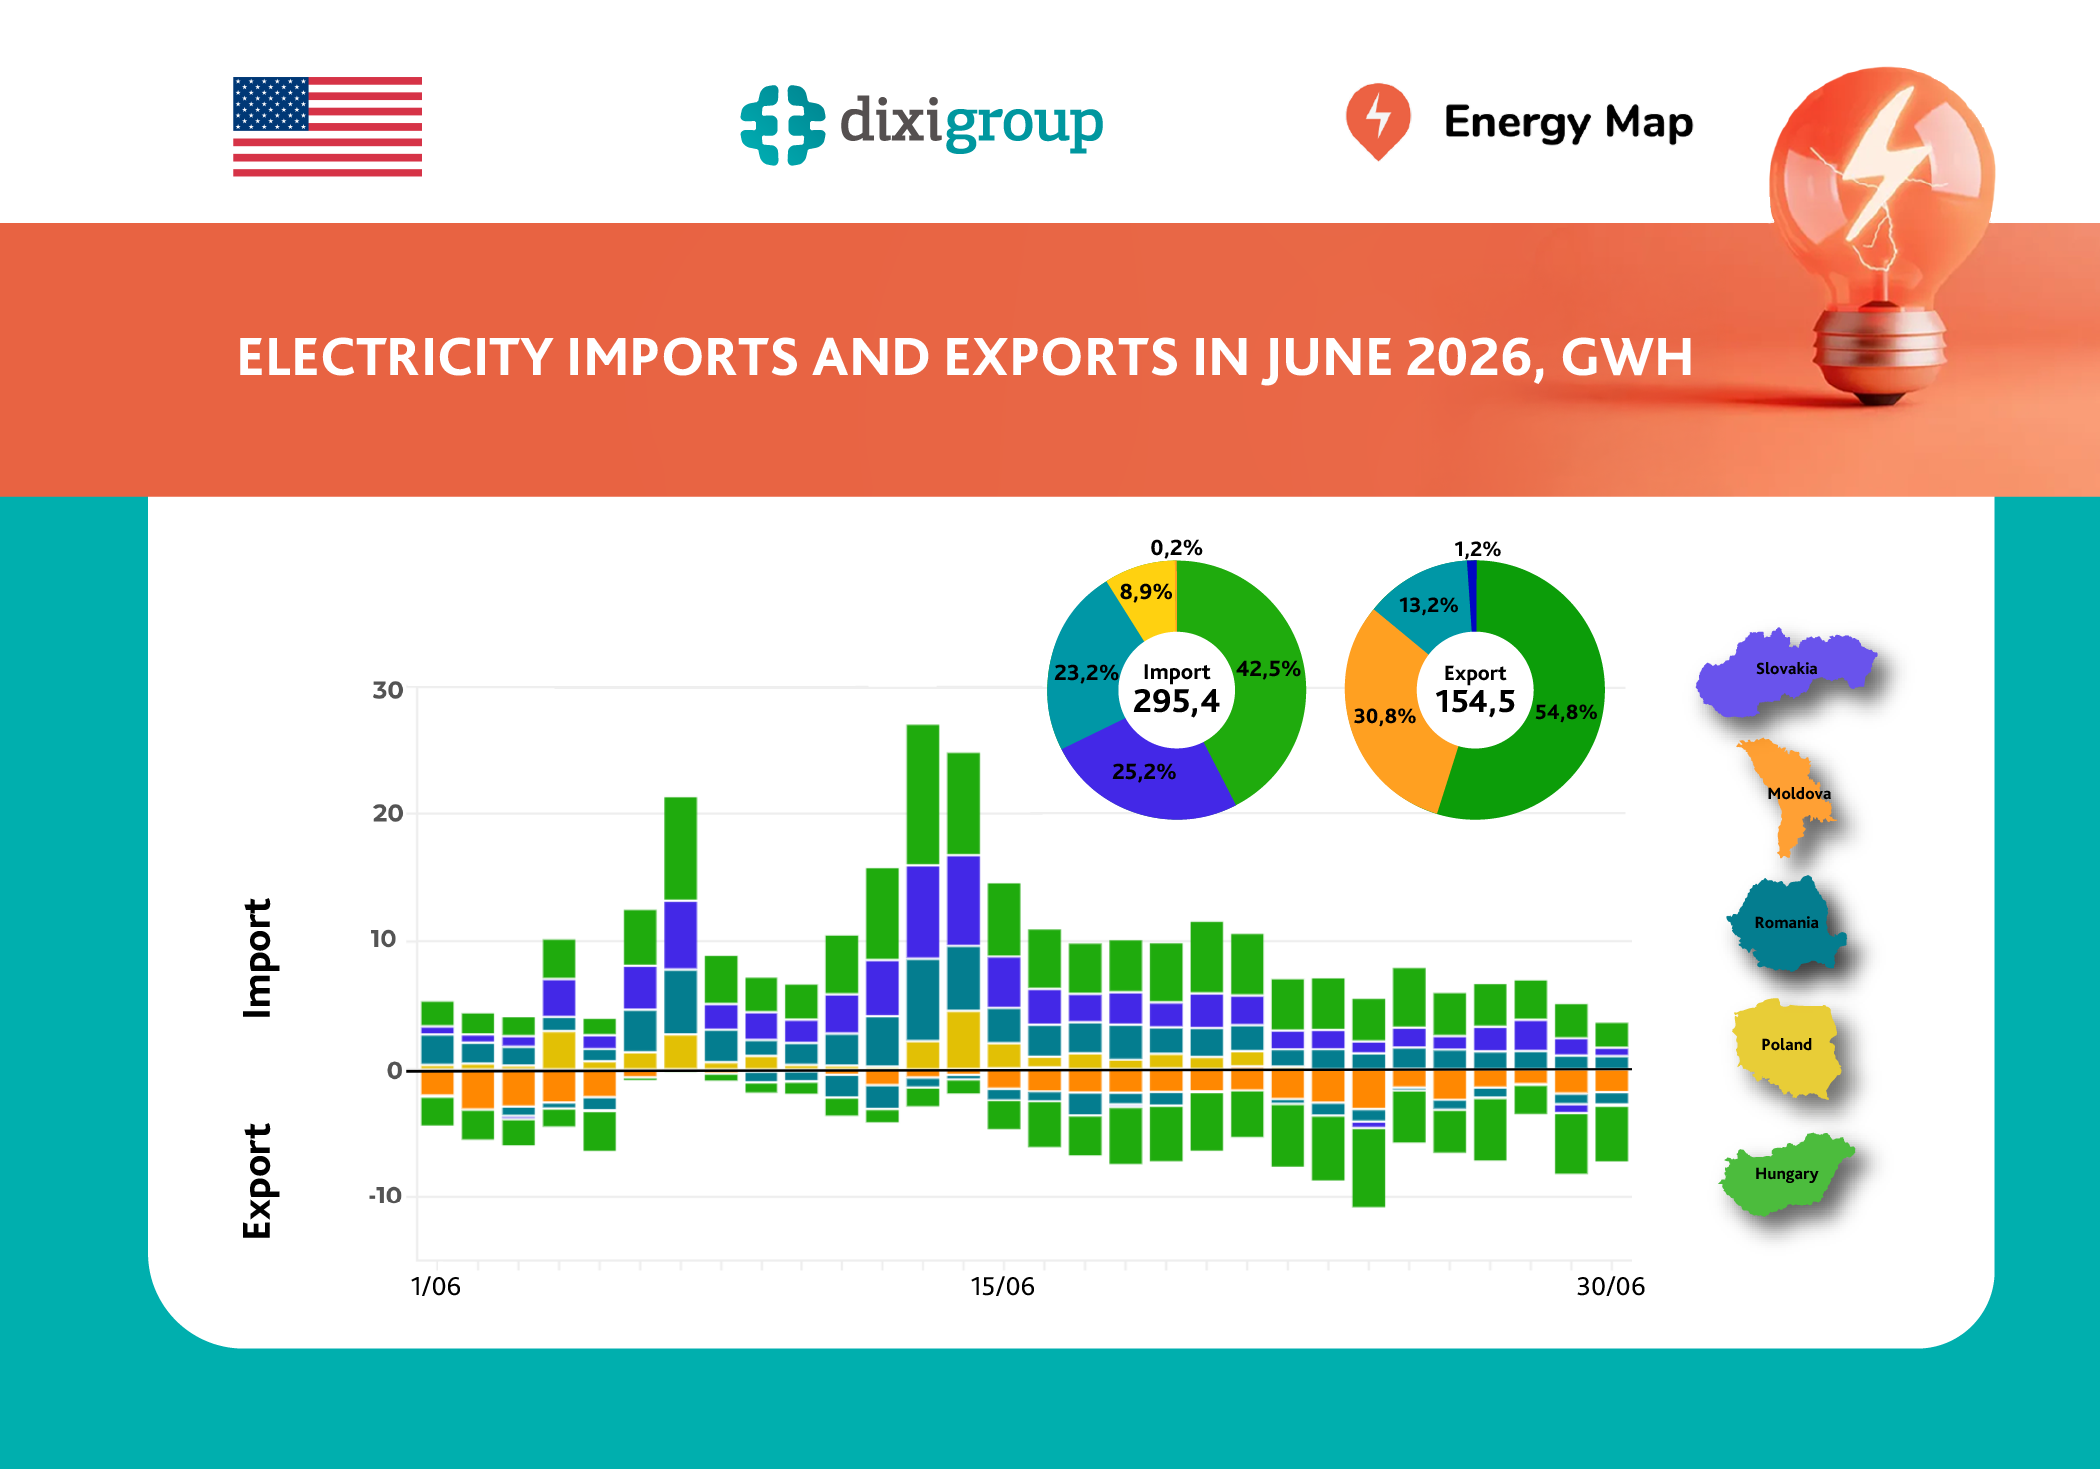
According to Energy Map, in June 2026 Ukraine reduced electricity imports by 26% compared to May, to 295.4 GWh. At the same time, exports surged by 64% to 154.5 GWh, reaching their highest monthly level since October 2025. Despite this significant boost in exports, Ukraine remained a net importer of electricity, with imports exceeding exports by a factor […]
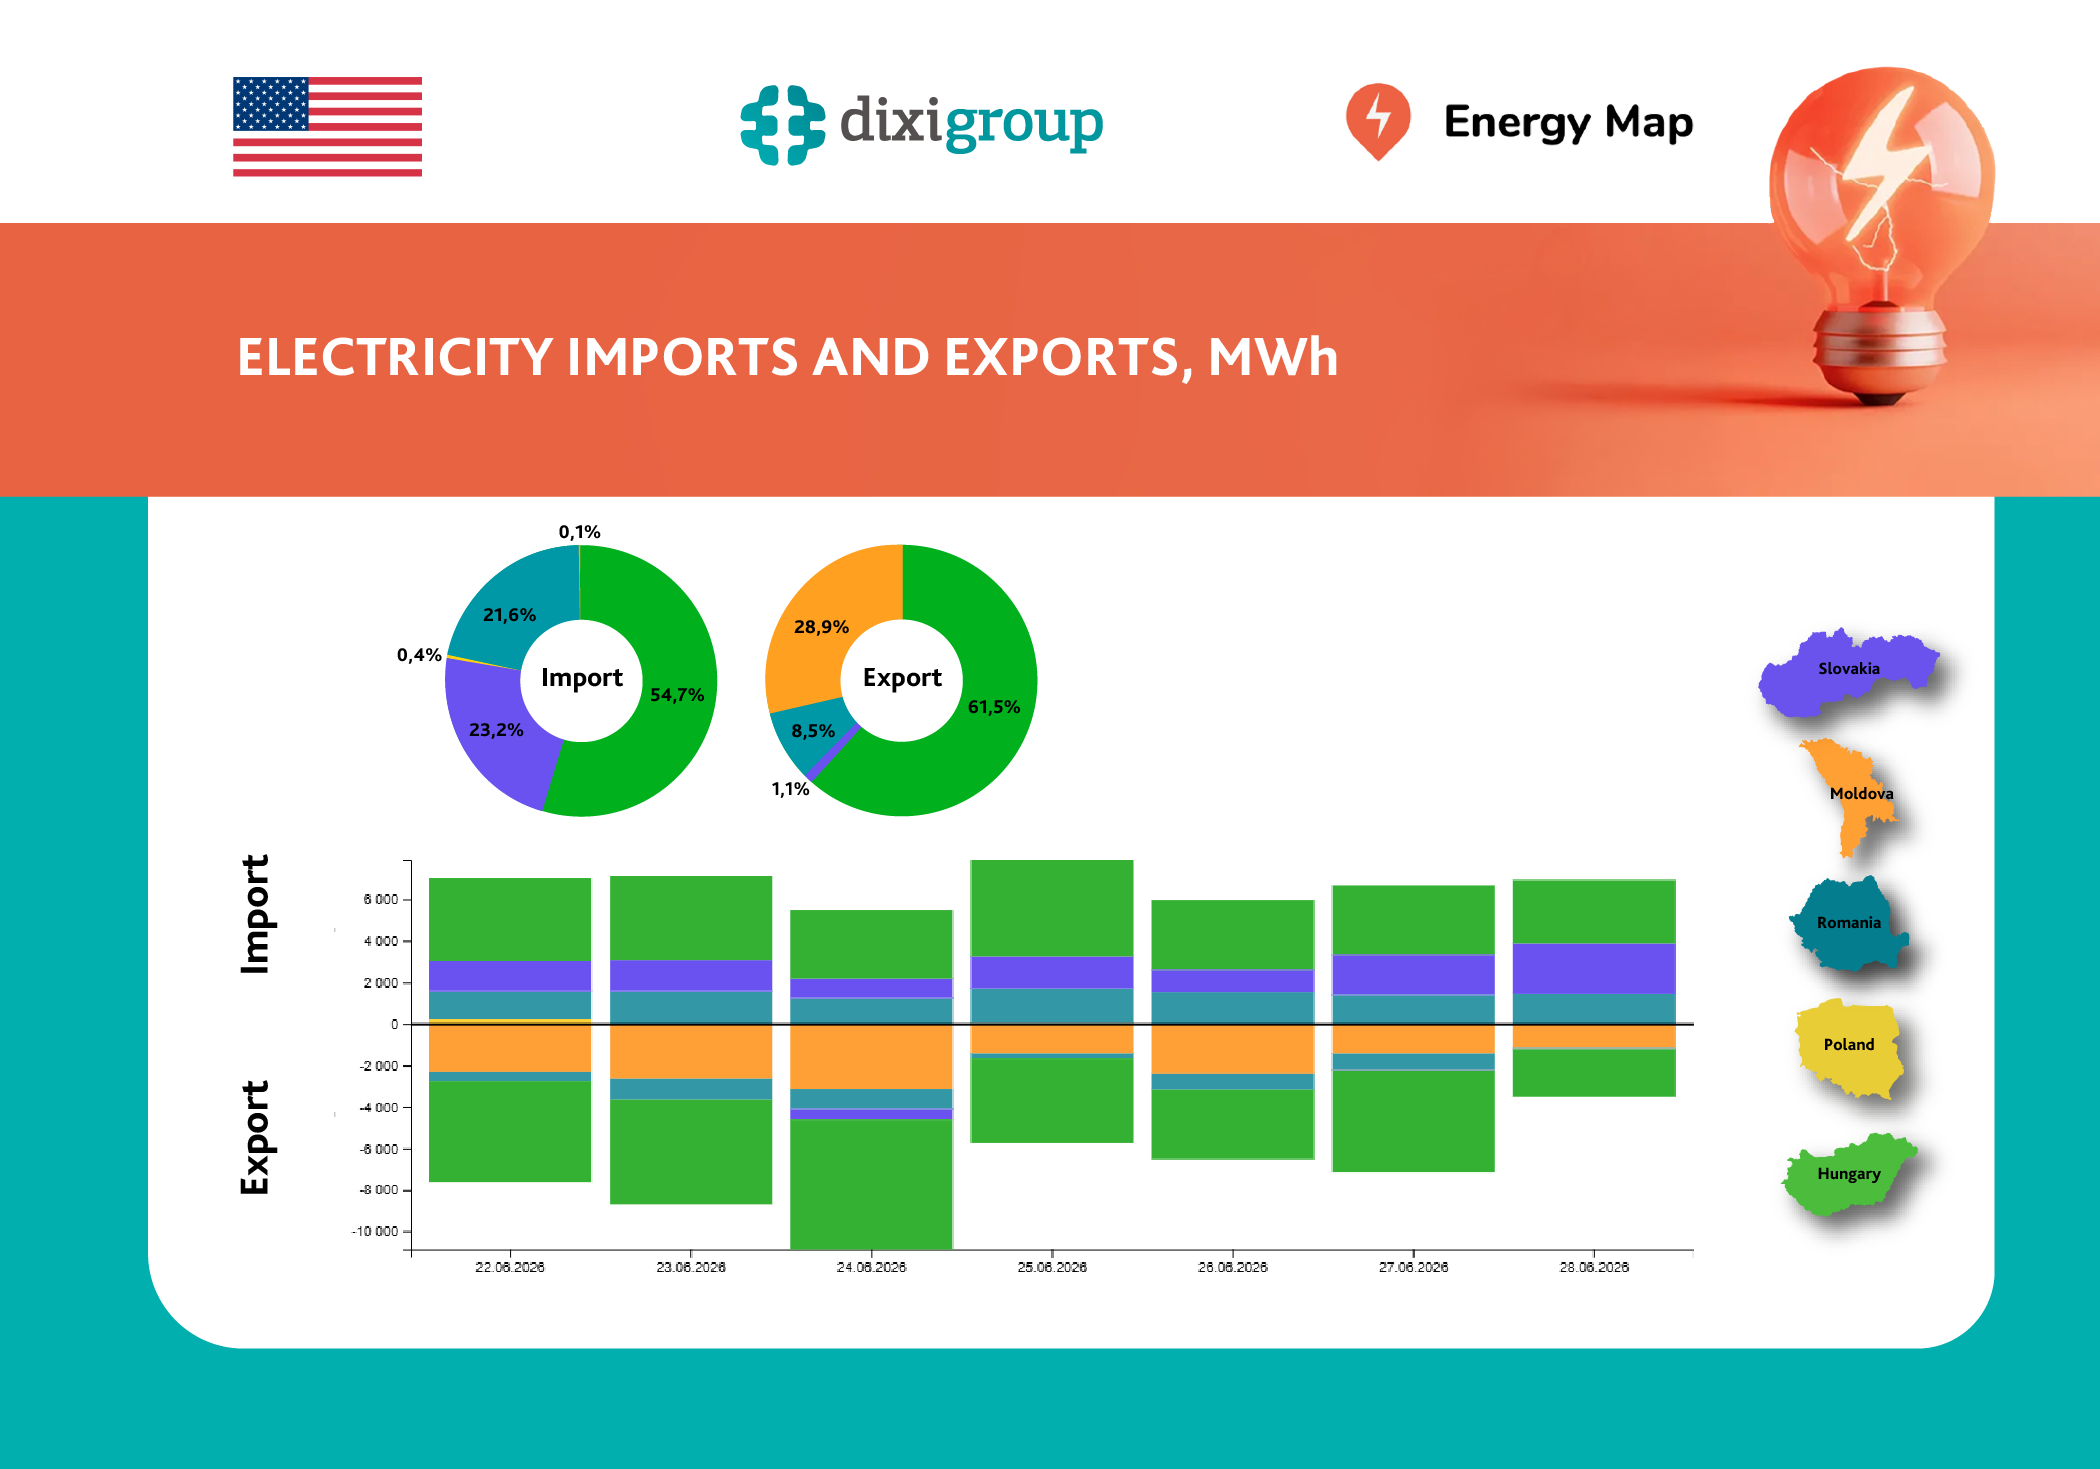
According to Energy Map, during the period of June 22-28, electricity imports to Ukraine decreased by 39% compared to the previous week – to 47.1 GWh. At the same time, exports increased by 14% to 50.1 GWh. Thus, for the first time since October 2025, Ukraine ended the week as a net exporter of electricity, […]
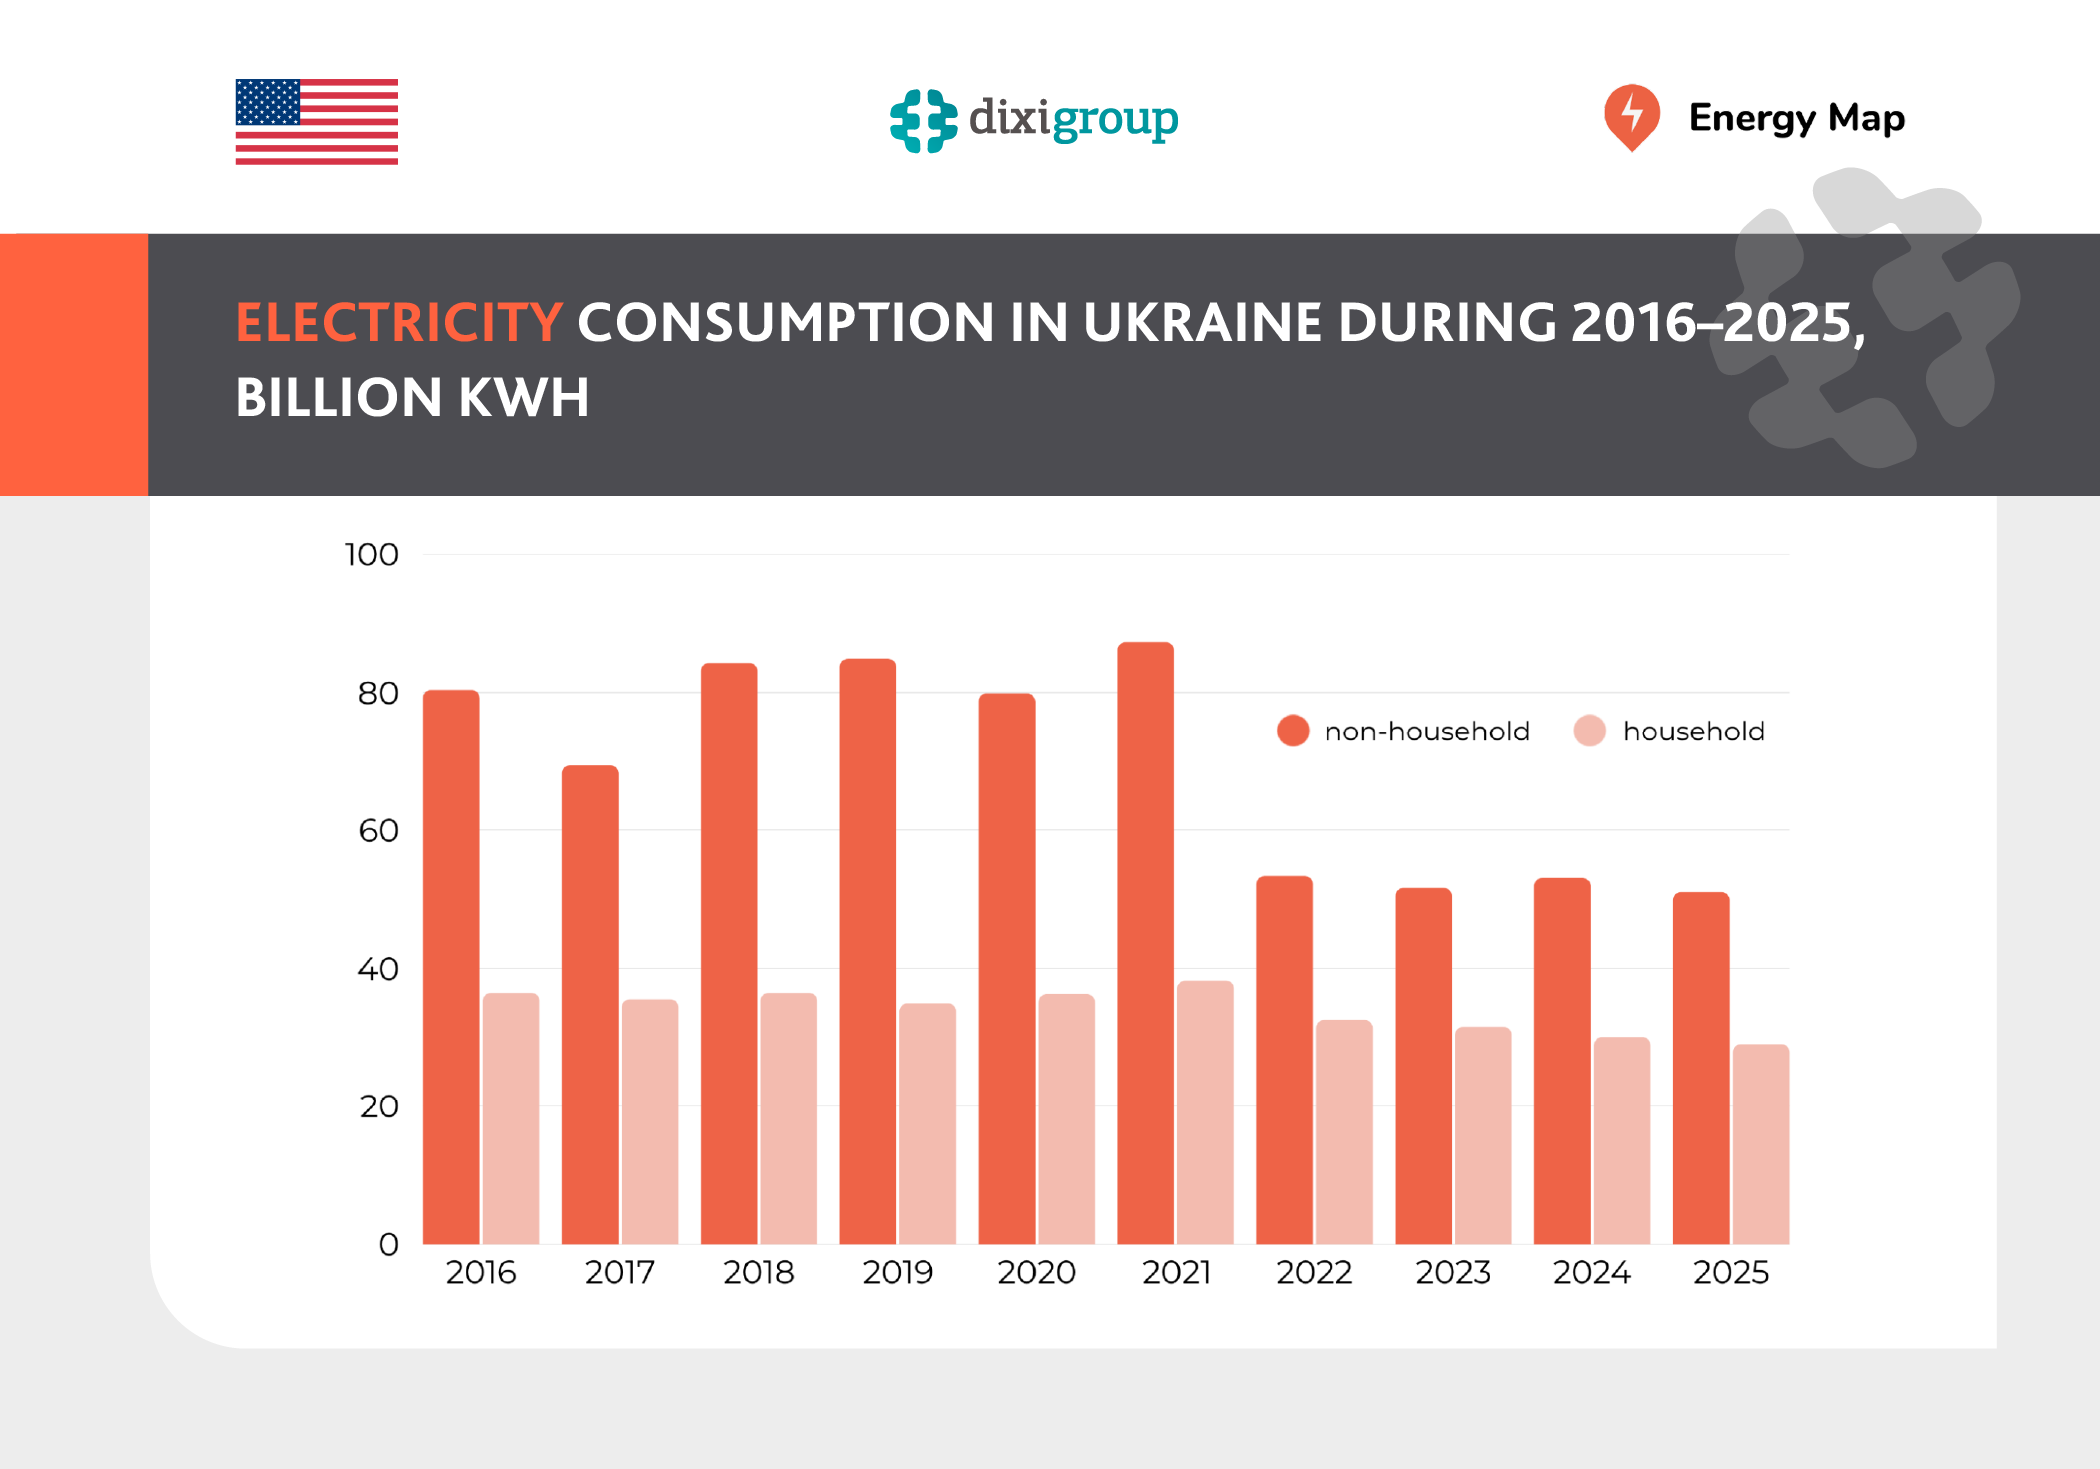
Last year, total electricity consumption in Ukraine amounted to 80.2 billion kWh, which is 3.6% lower compared to 2024 and 36.2% lower compared to 2021, before the full-scale war. Of this volume, 51.1 billion kWh was consumed by non-household consumers, while 29.1 billion kWh was consumed by households. This is according to data from the […]
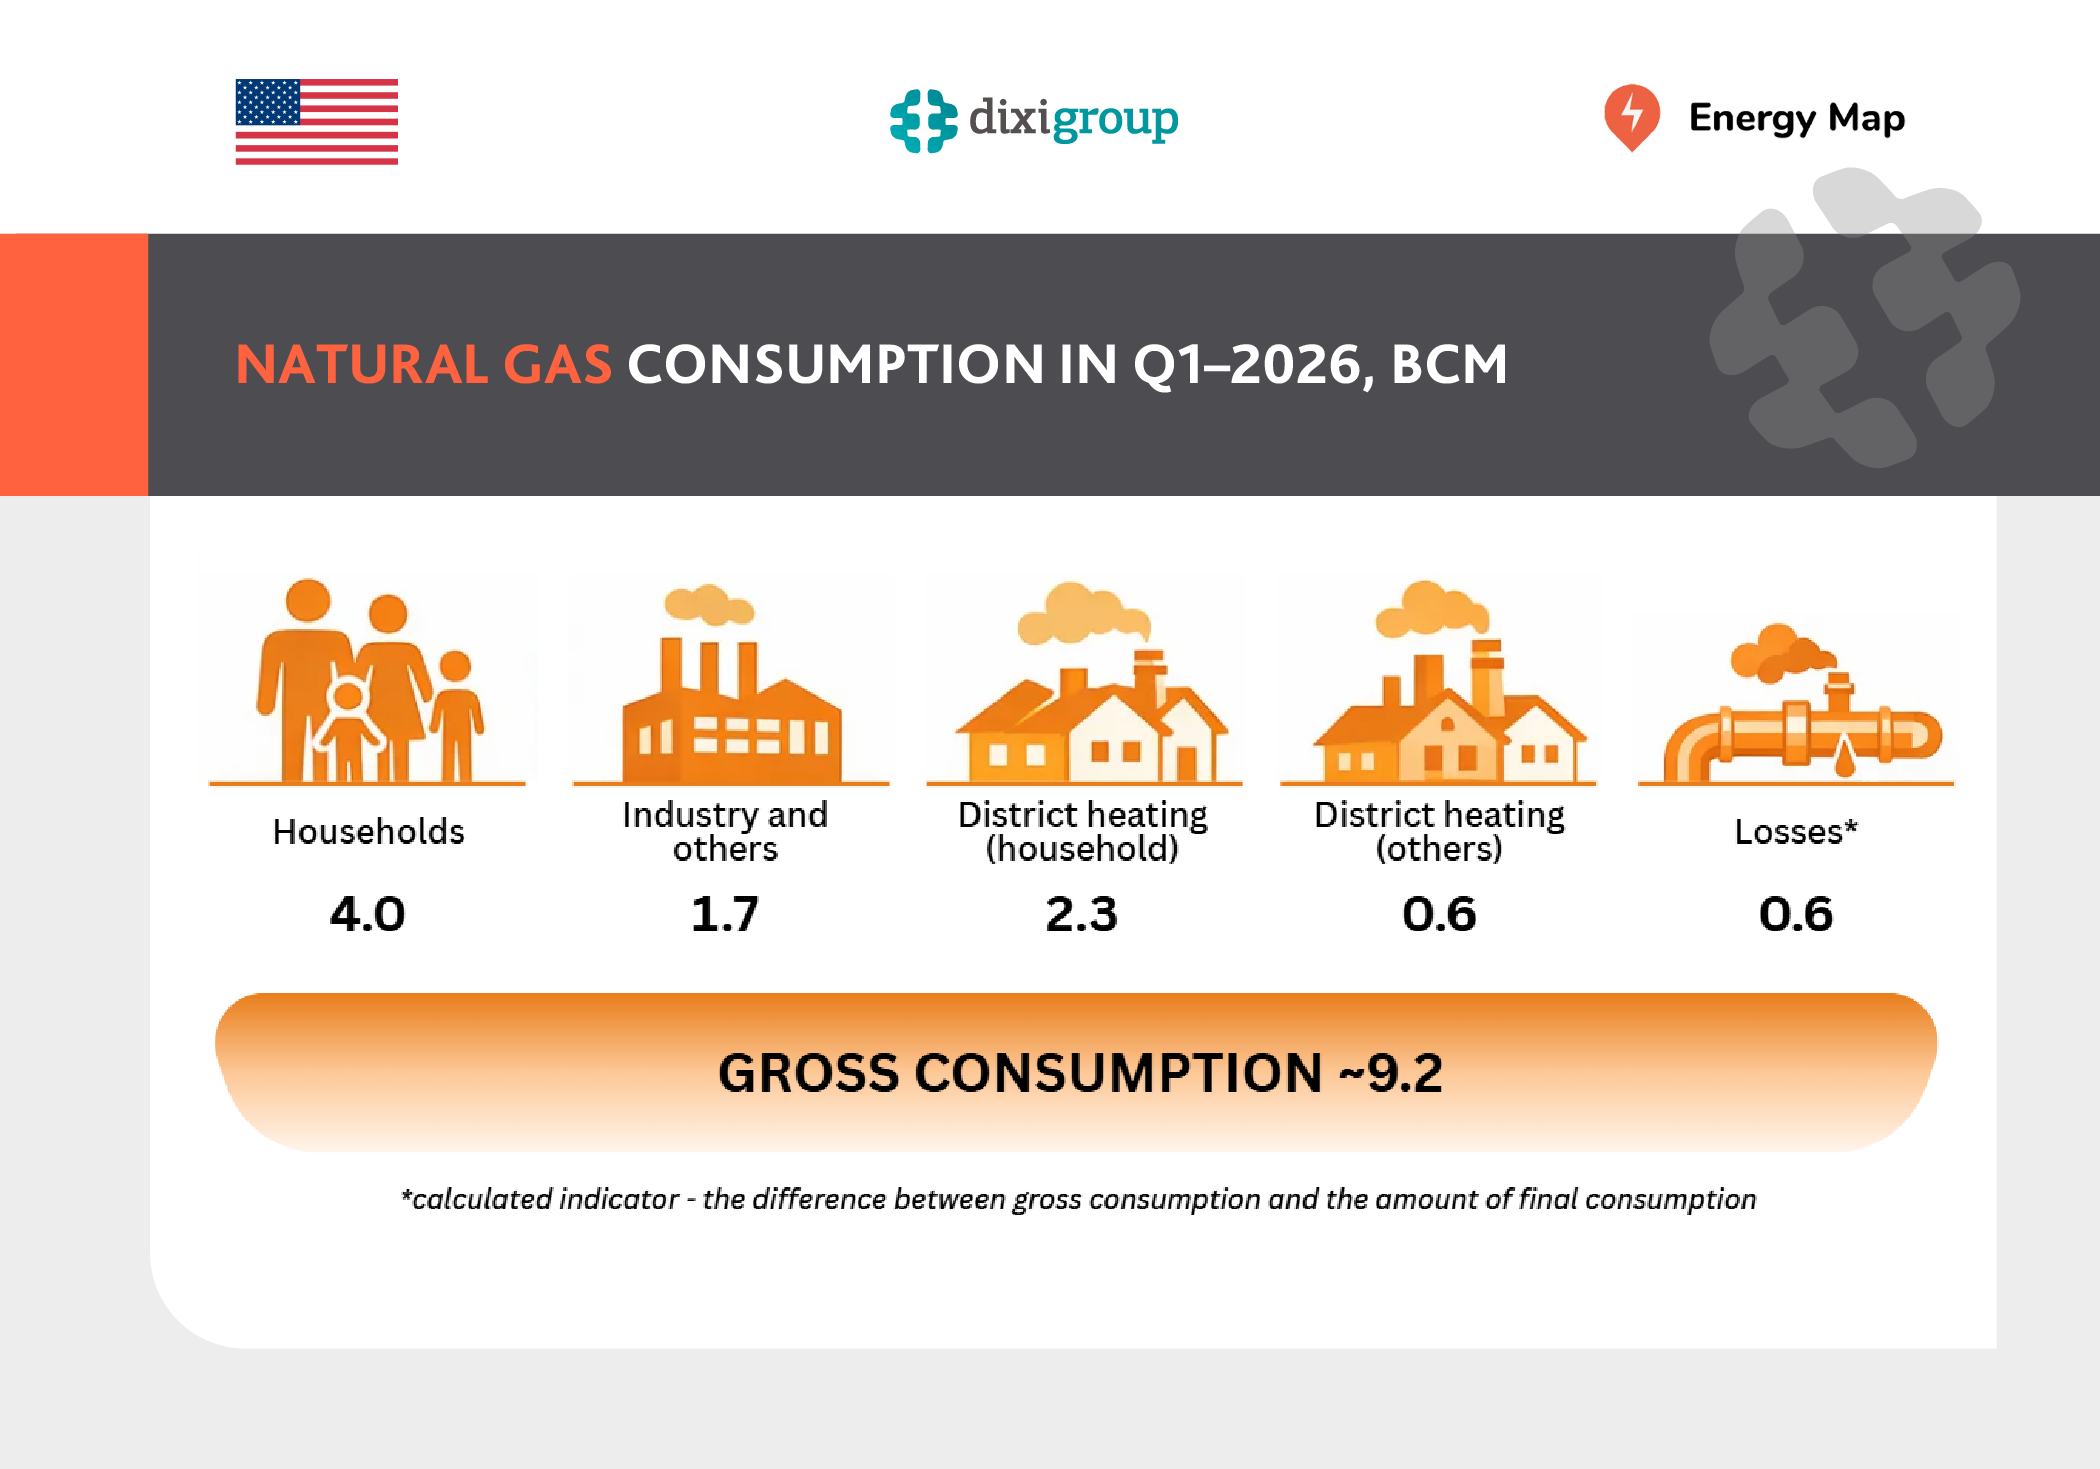
According to data from the Energy Regulator of Ukraine (NEURC) published on the Energy Map portal, gross natural gas consumption in Ukraine amounted to 9.2 bcm in the first quarter of 2026. This is 2% more than in the same period of 2025 (9.0 bcm). The increase in demand was driven primarily by residential and […]
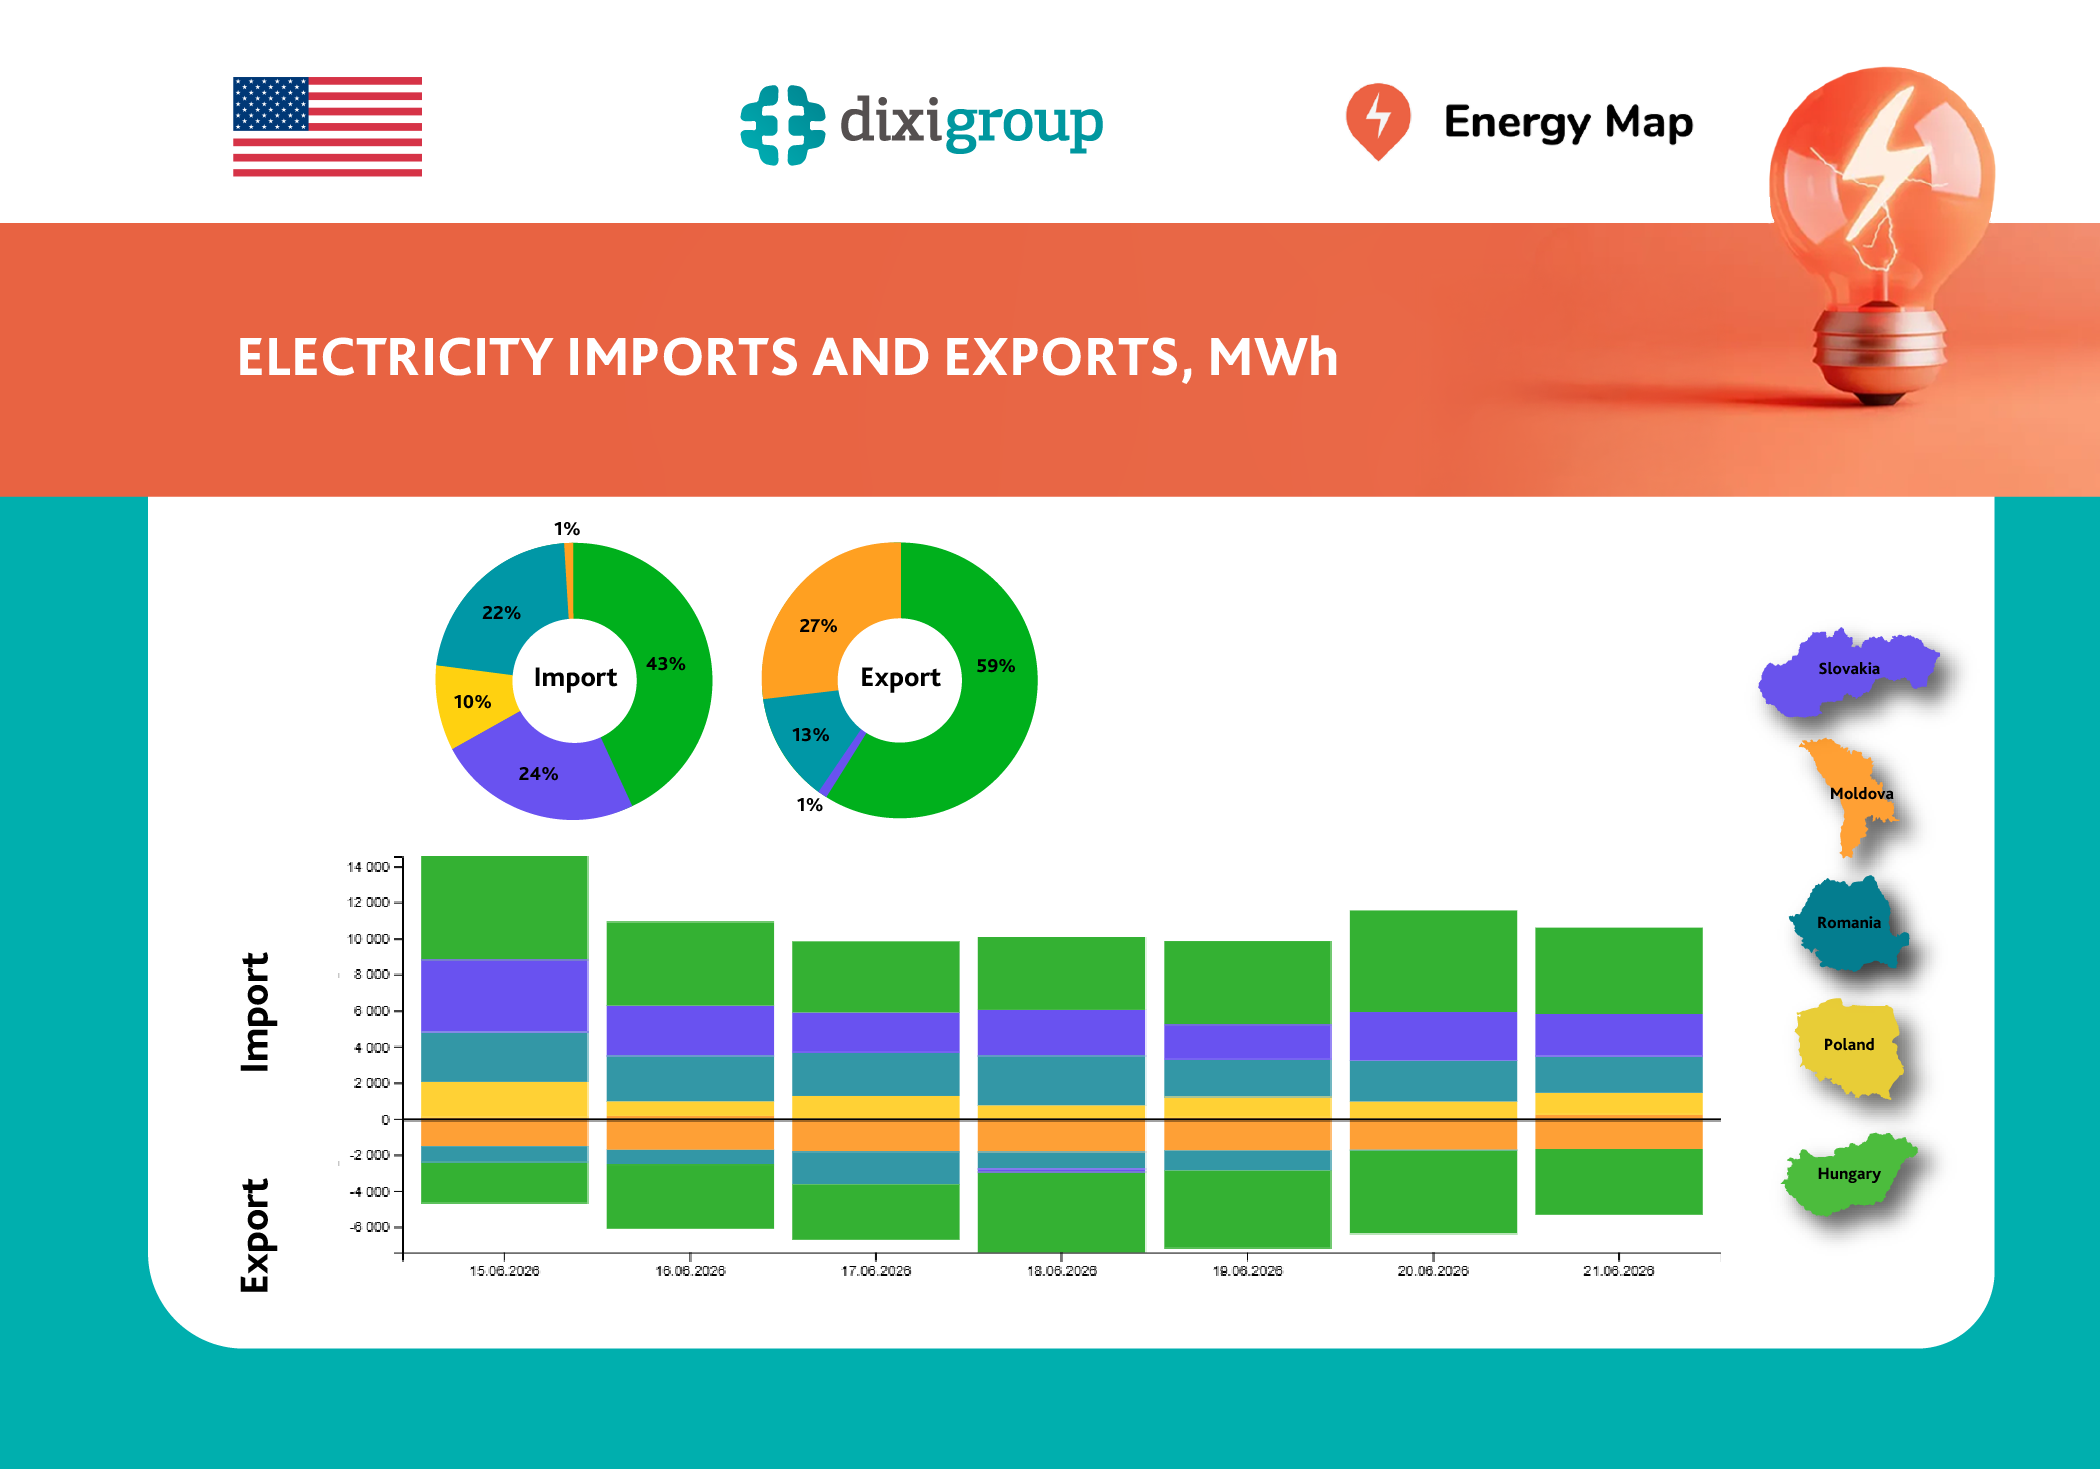
According to Energy Map, during the period of June 15-21, electricity imports to Ukraine decreased by 23% compared to the previous week and amounted to 77.4 GWh. At the same time, exports increased by 2.5 times – to 43.9 GWh, which is the maximum weekly figure since October 2025. Sunny weather and comfortable temperatures increased the output of […]
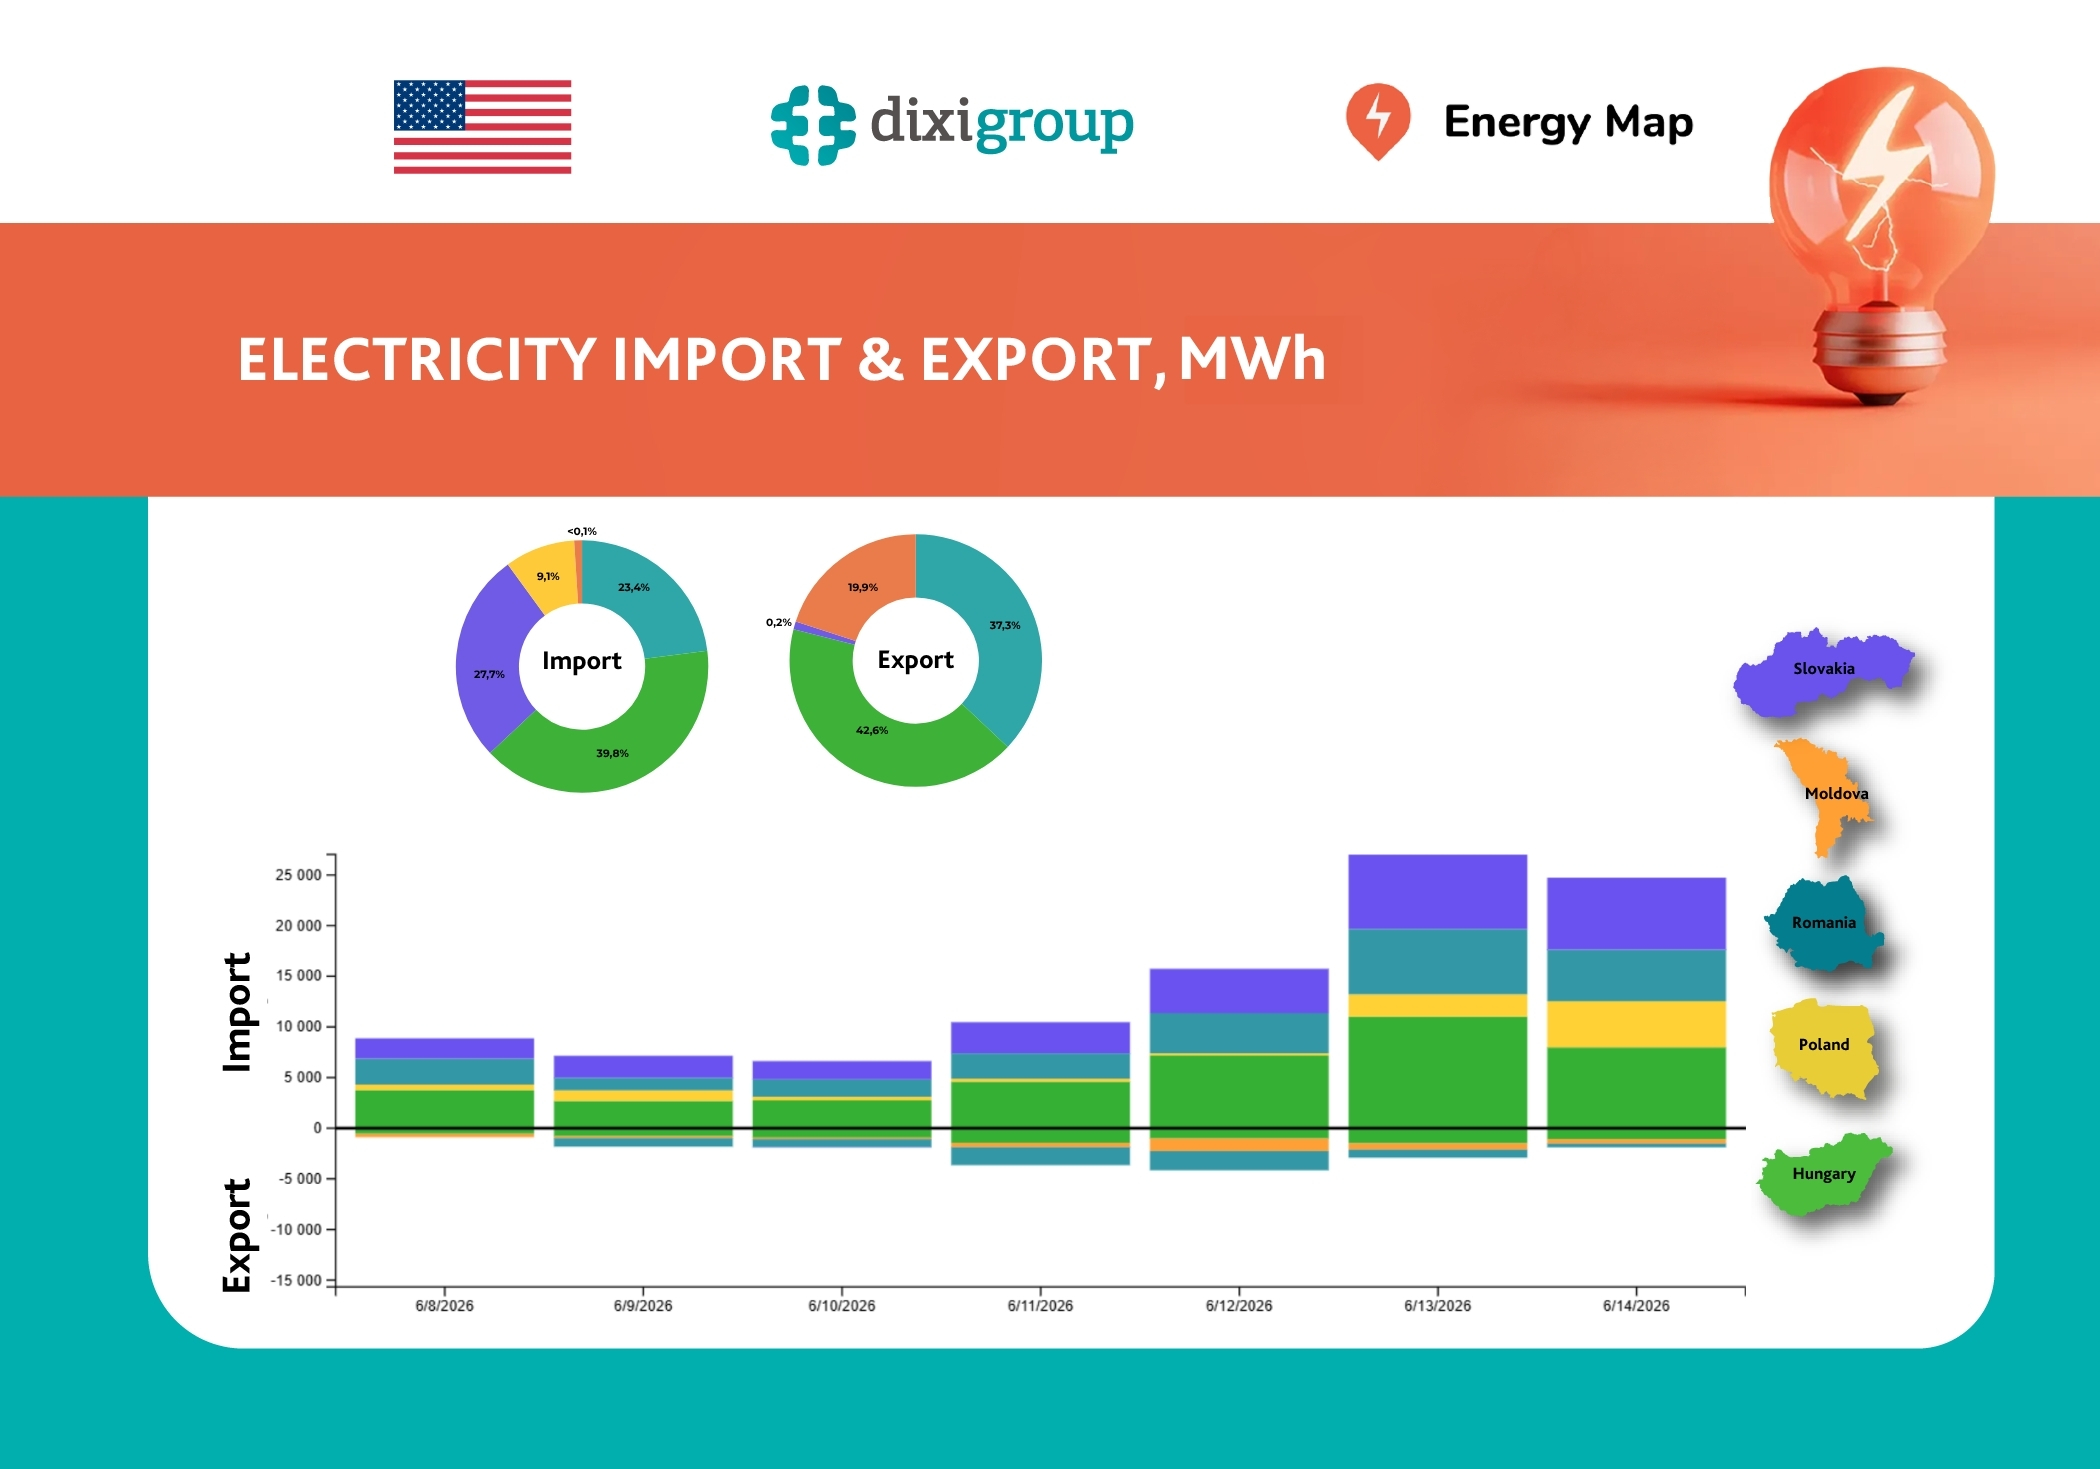
According to Energy Map, between June 8 and 14, electricity imports to Ukraine increased by 63% compared to the previous week – to 100.6 GWh. Exports decreased by 38% and amounted to 17.2 GWh. During the week, consumer demand was fully covered by domestic electricity generation and commercial imports, without the need to implement any electricity consumption restrictions. Import […]
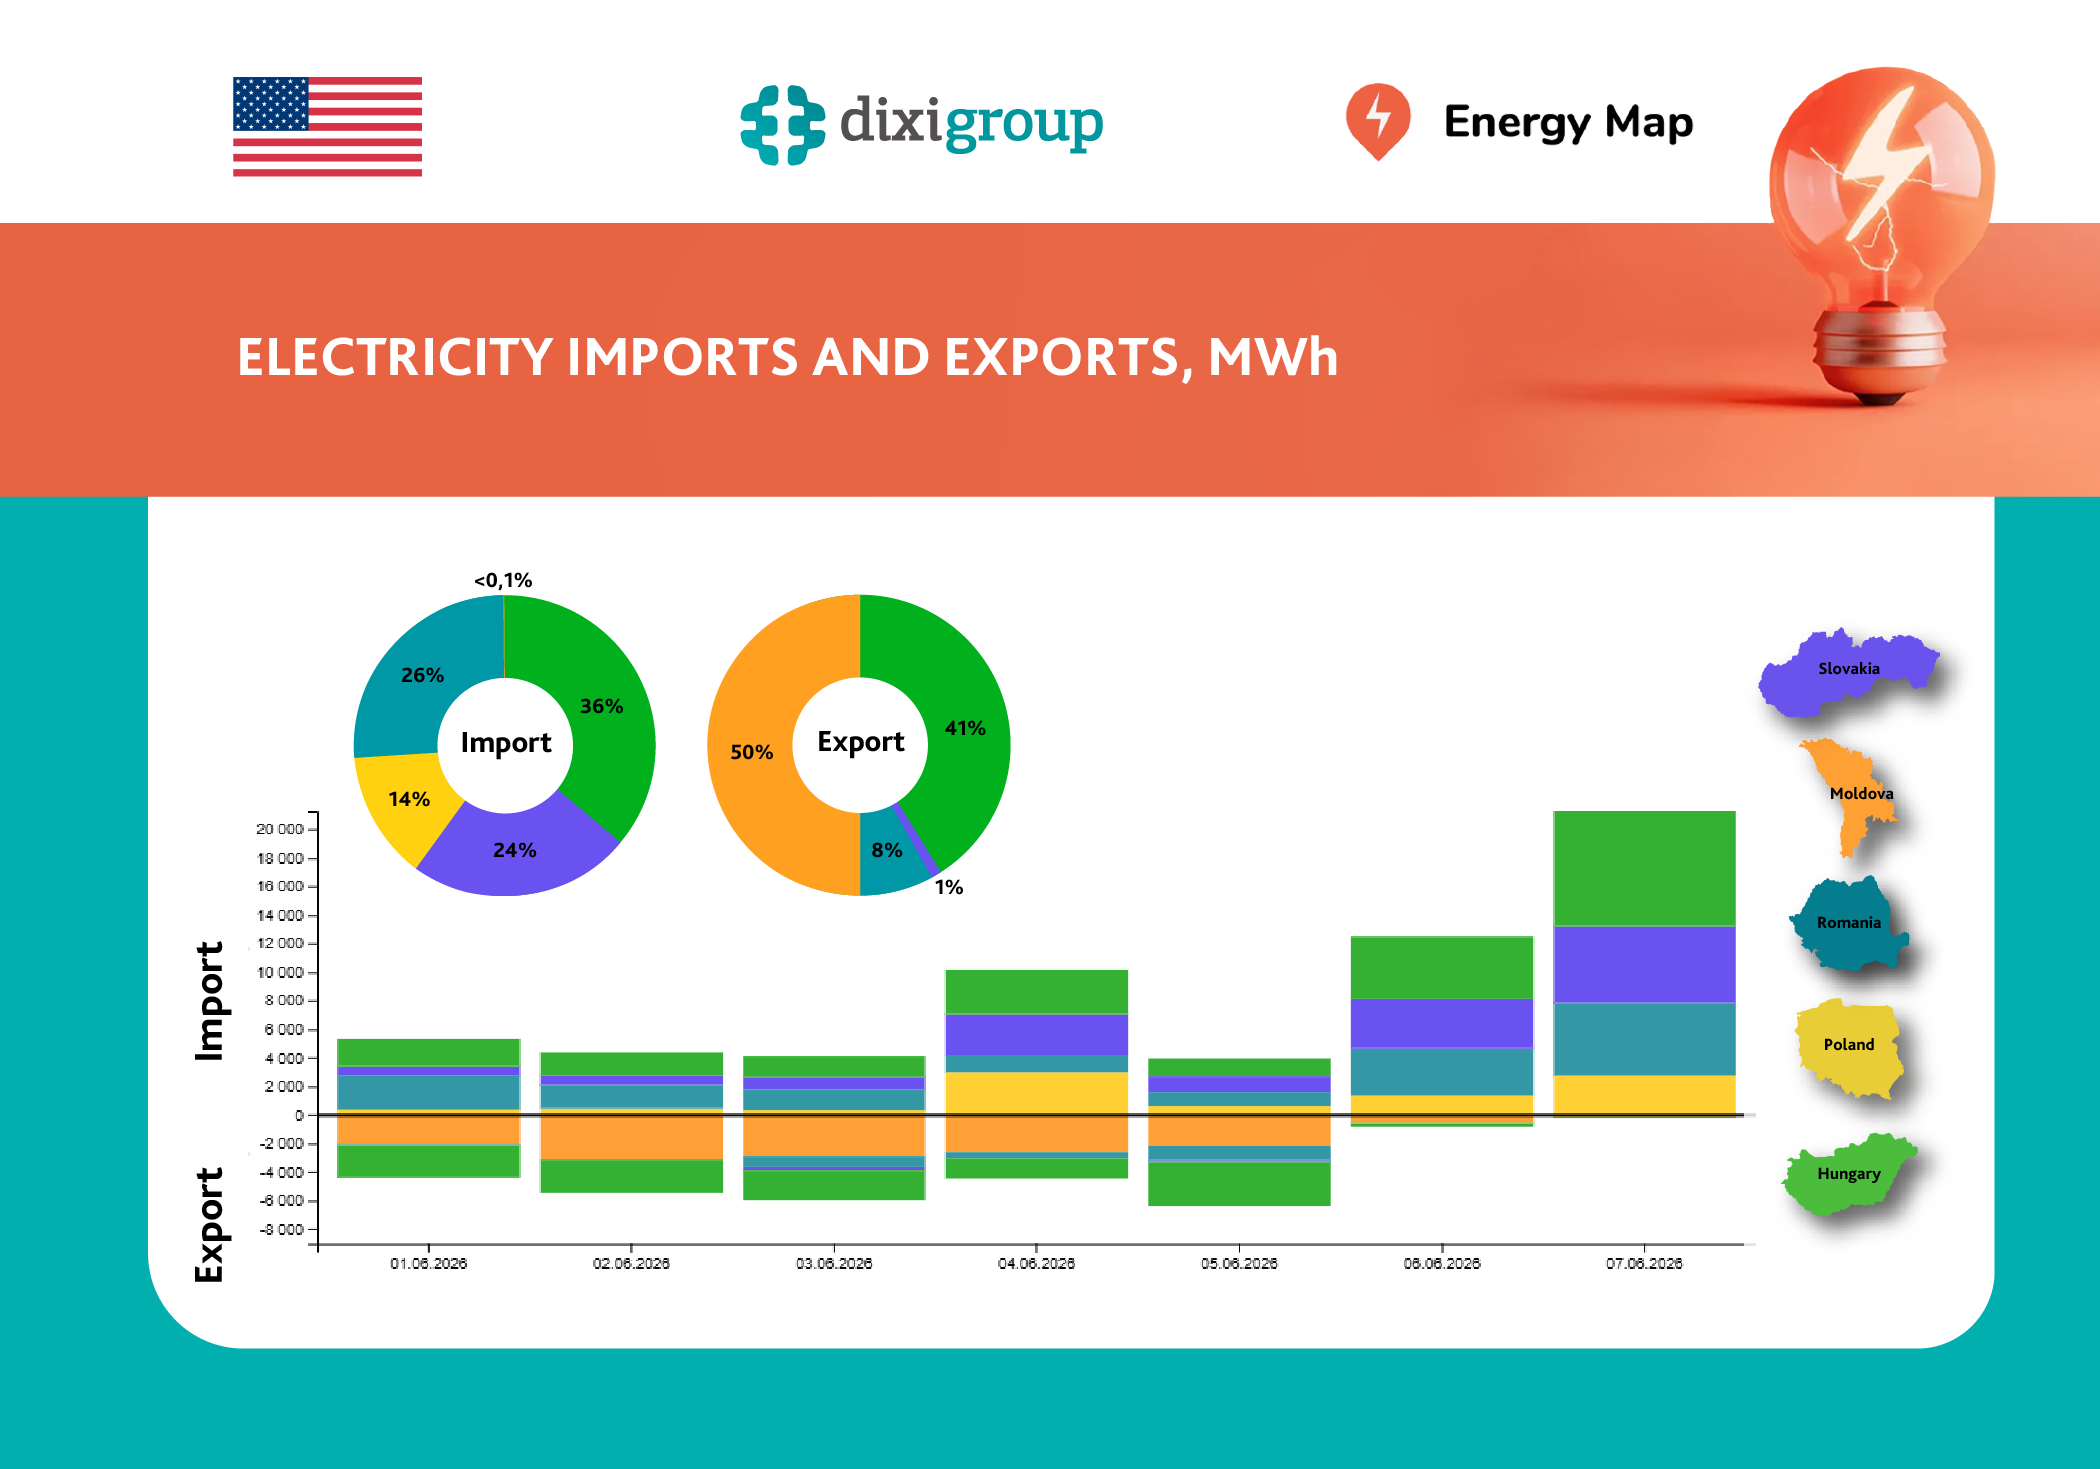
According to Energy Map, during June 1-7, electricity imports to Ukraine decreased by 37% compared to the previous week – to 61.6 GWh. This is the first decrease in the indicator in the last four weeks. Exports also decreased – by 20%, to 27.9 GWh. Despite russian attacks on the energy infrastructure, including a massive missile […]
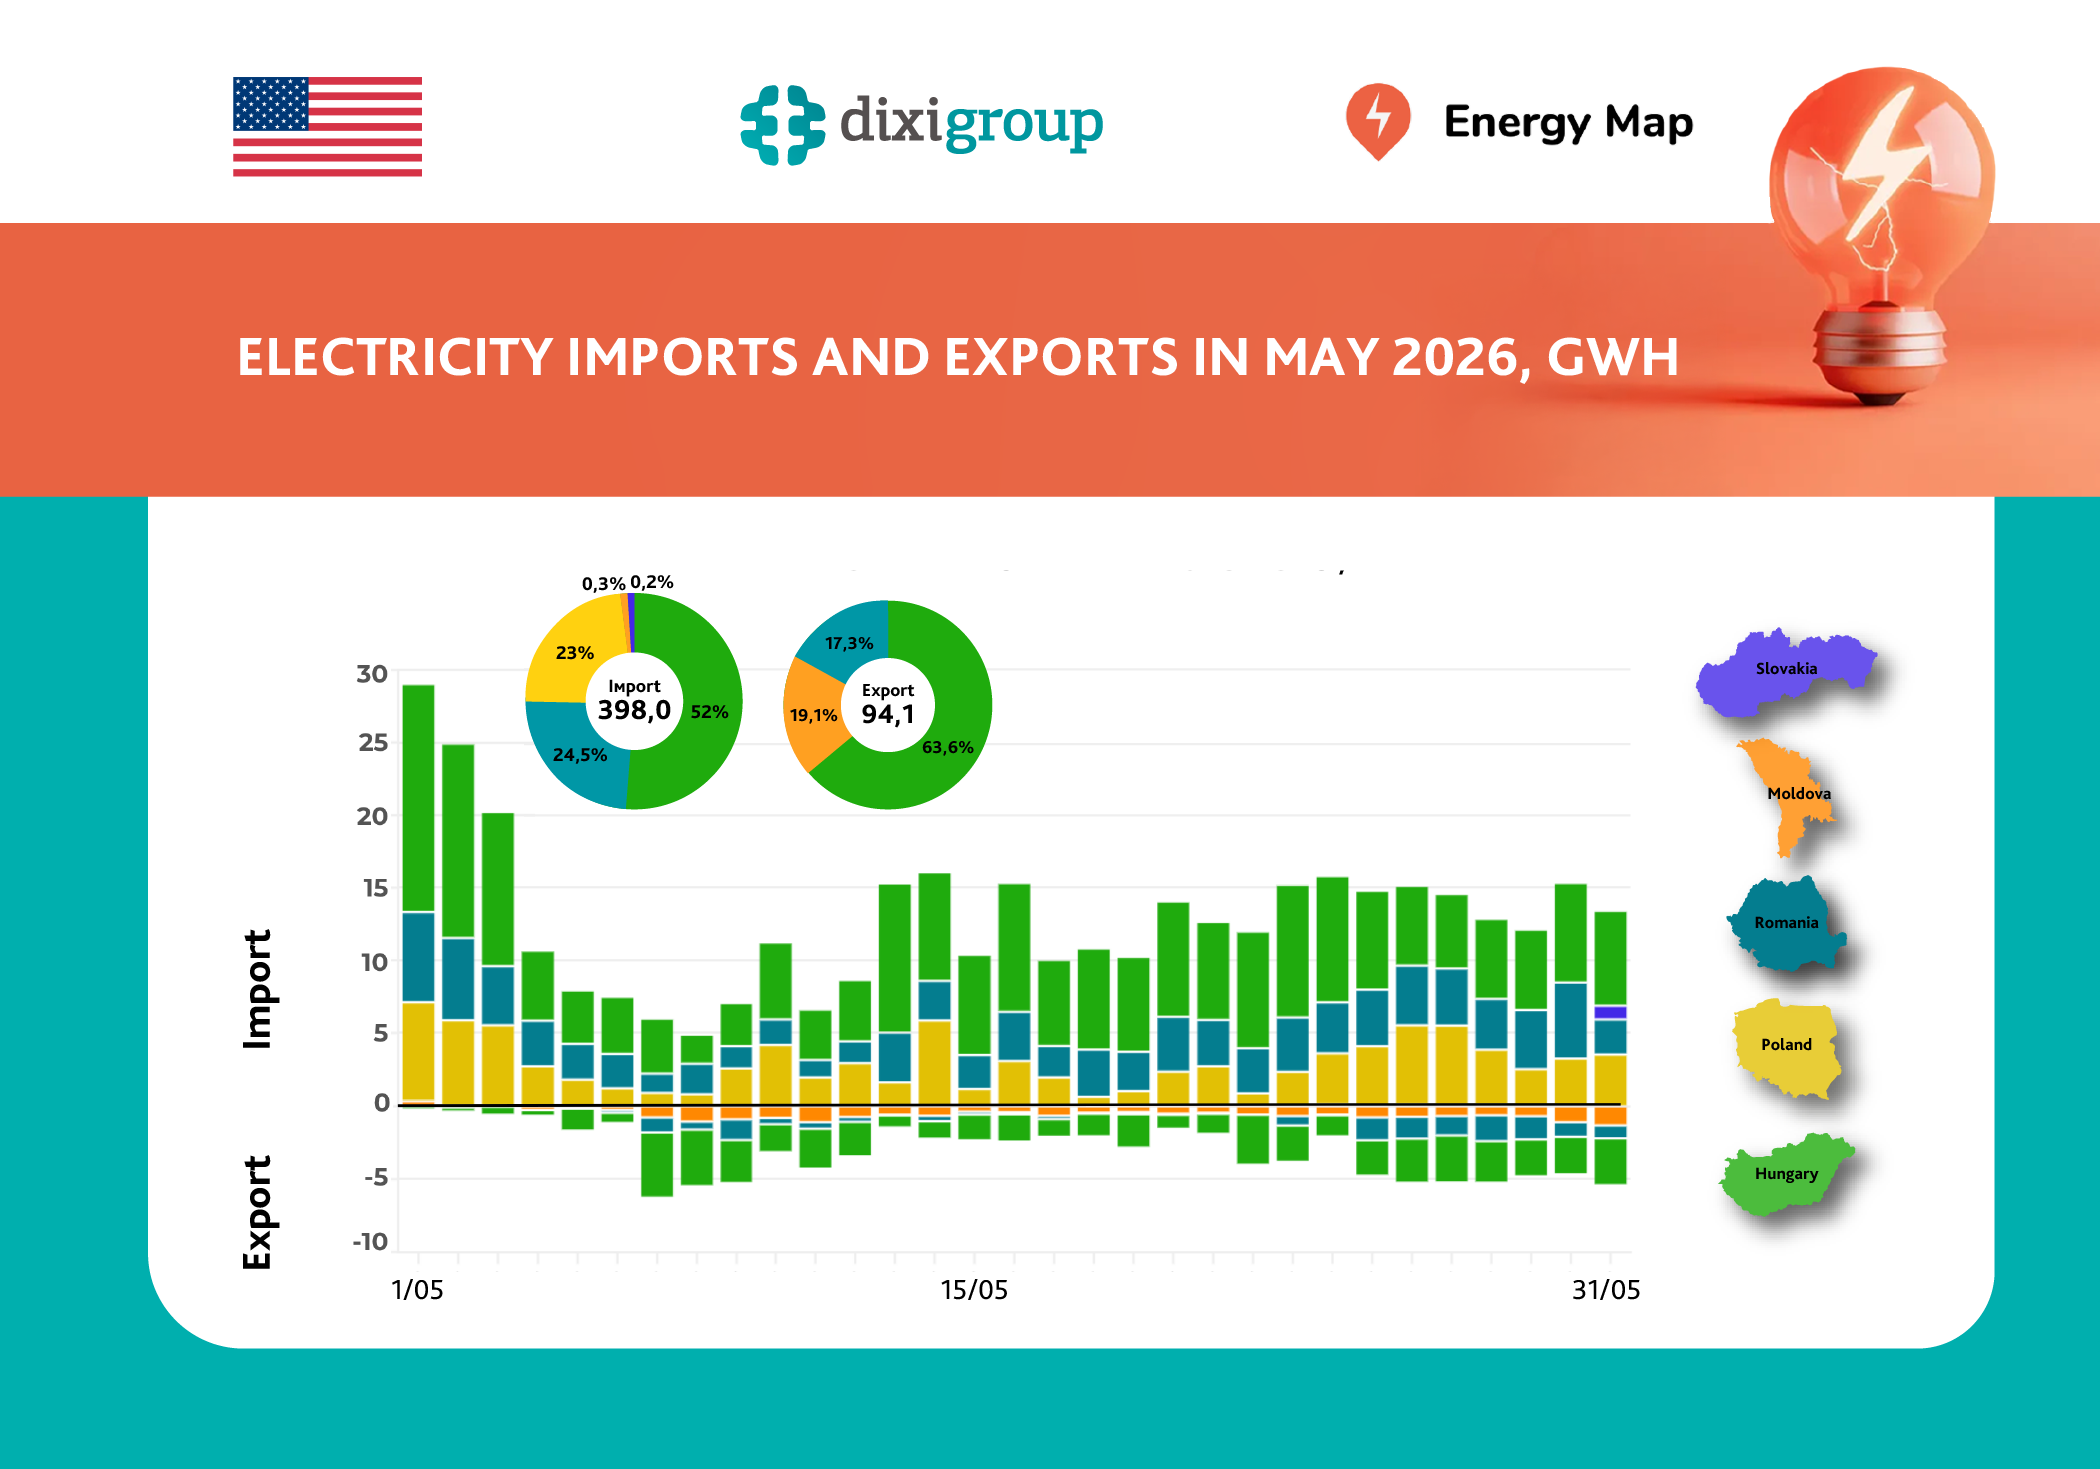
According to Energy Map, in May 2026 Ukraine reduced electricity imports by 29% compared to April, to 398.0 GWh. This is the third month in a row when the volume of import supplies has decreased. At the same time, electricity exports increased by 2.8 times, reaching 94.1 GWh. Despite this growth, Ukraine remained a net importer […]
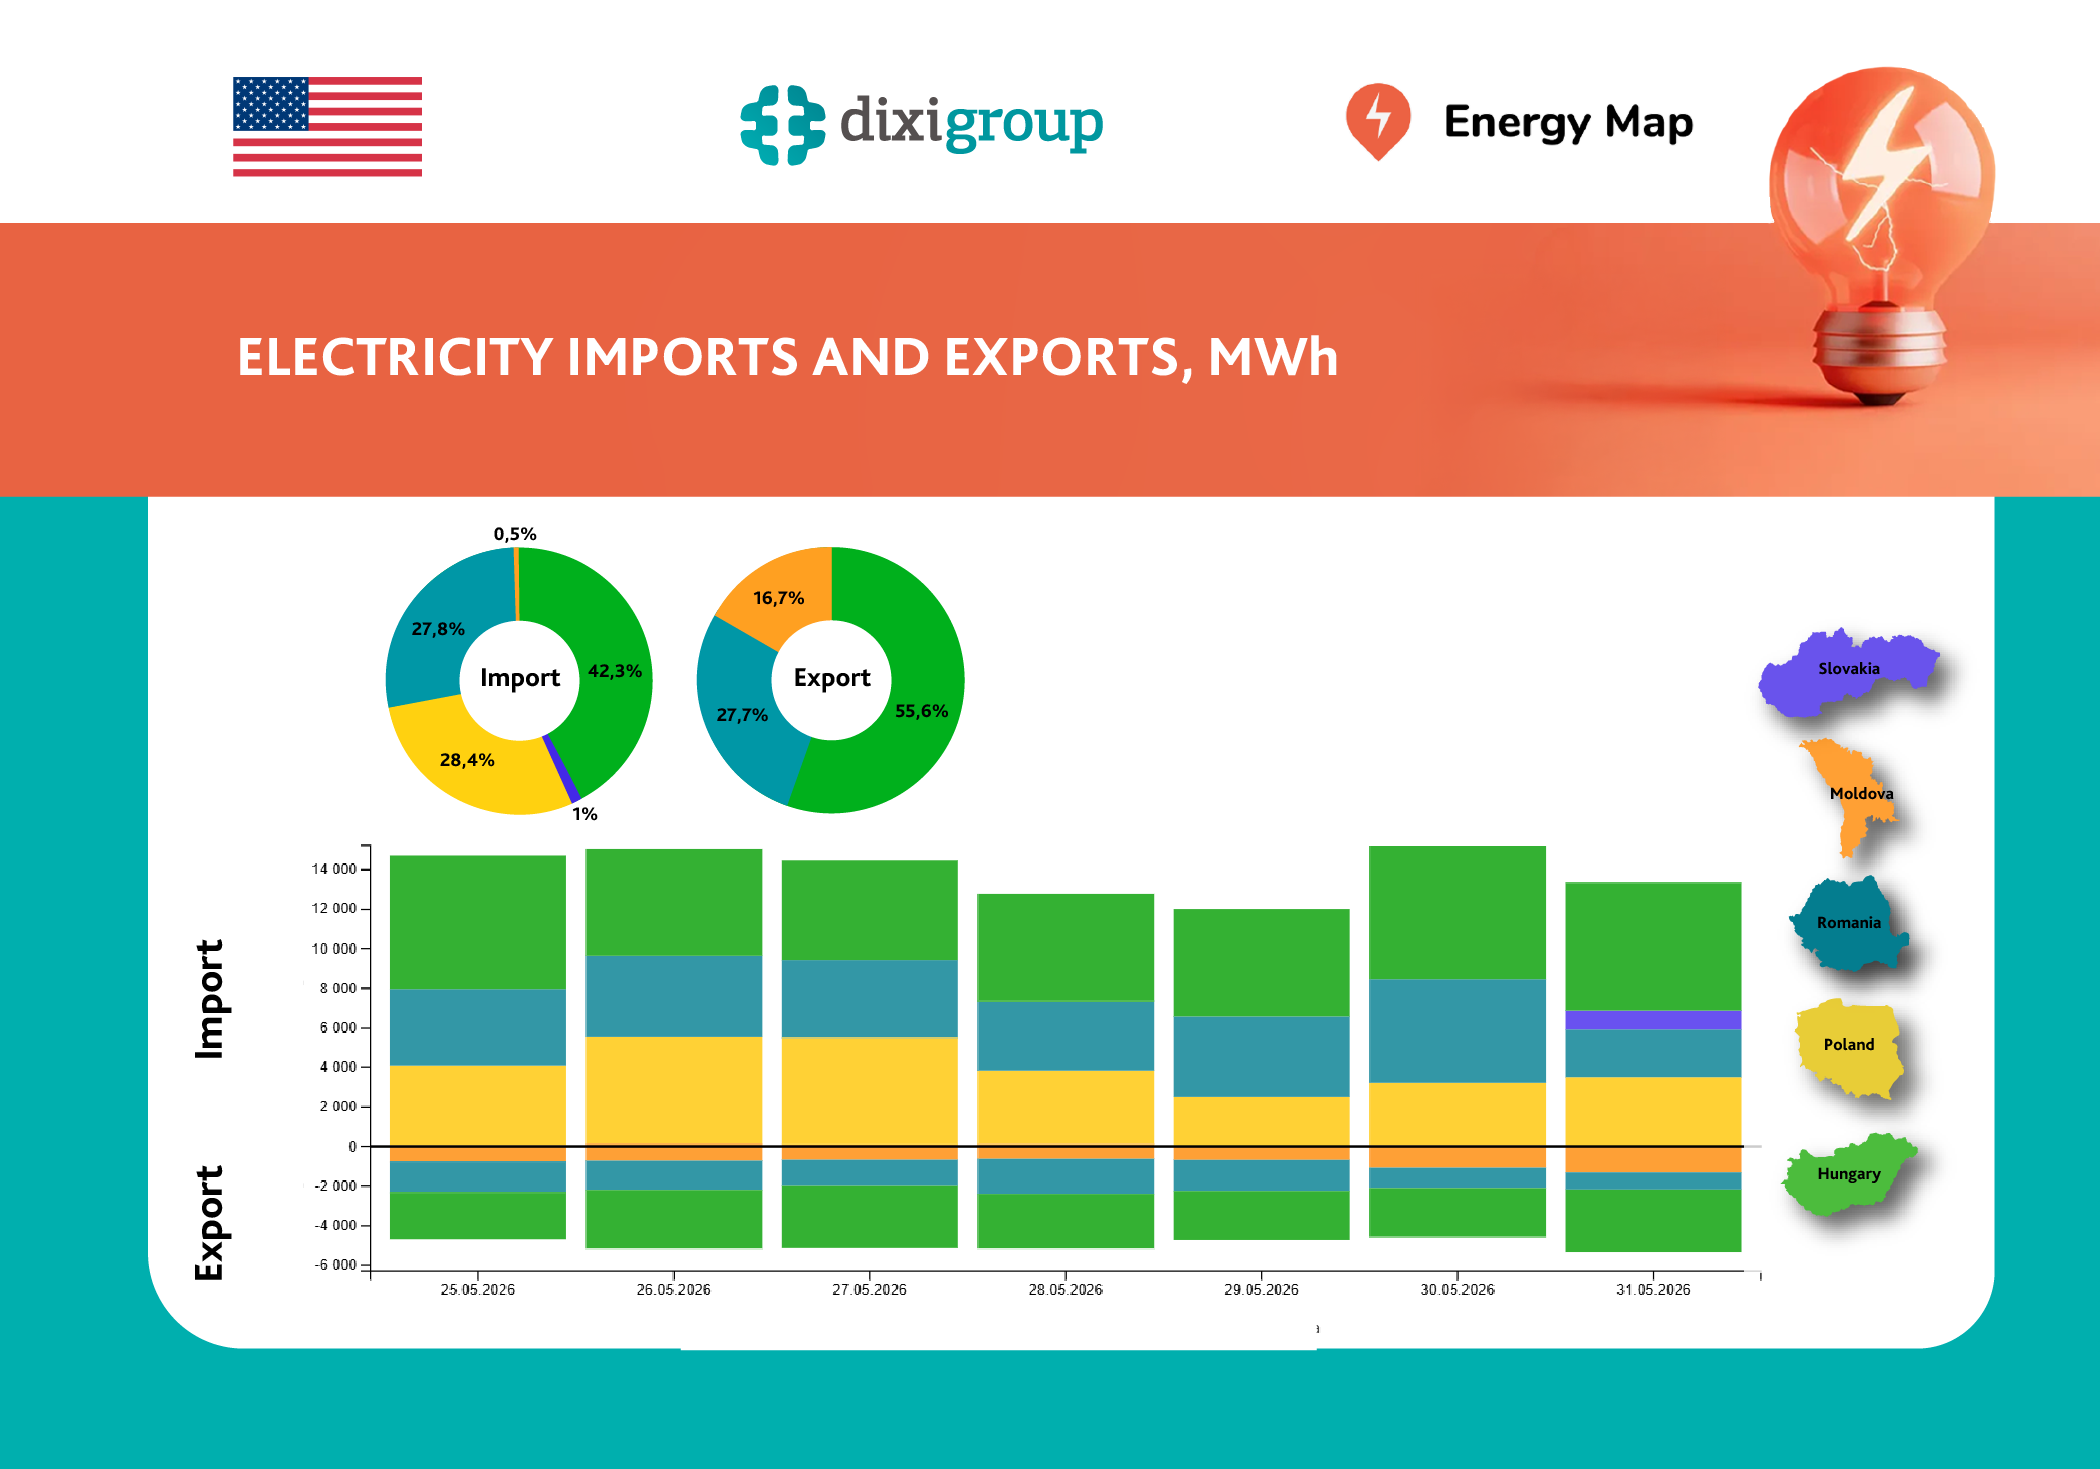
According to Energy Map, during May 25-31, electricity imports to Ukraine increased by 8% compared to the previous week – to 97.6 GWh. Exports increased by 97% to 34.8 GWh. At the same time, electricity imports exceeded exports by 2.8 times. Throughout the reporting period, consumer demand was fully covered by domestic electricity generation and commercial […]