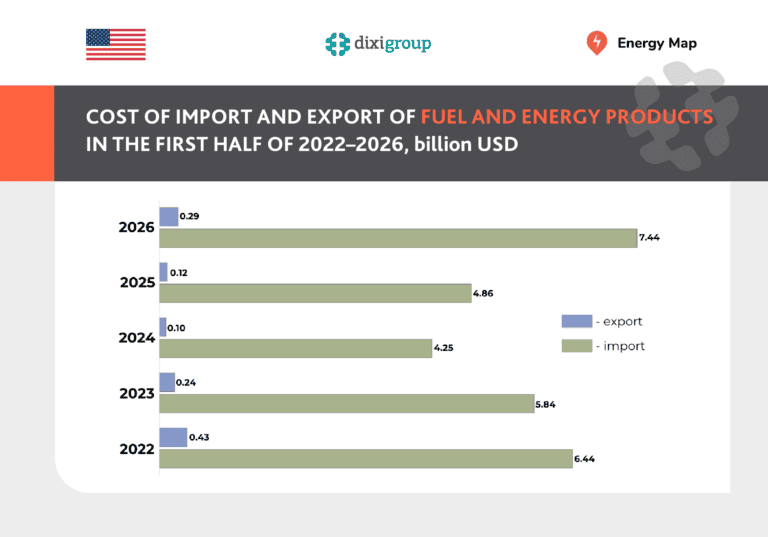
In the first half of 2026, Ukraine imported 13 categories of fuel and energy products* from 61 countries with a total value of USD 7.44 billion, up 53.1% (USD 2.58 billion) compared to the same period in 2025. Export revenues also increased, rising 2.4-fold from USD 122.38 million to USD 293.63 million.
Despite the faster growth in exports, the value of imports exceeded exports by 25.3 times. As a result, Ukraine’s trade deficit in fuel and energy products amounted to USD 7.15 billion in the first half of 2026.
The analysis is based on the dataset covering Ukraine’s imports and exports of commodities classified under Group 27 of the Ukrainian Classification of Goods for Foreign Economic Activity (UCG FEA), compiled from responses provided by the State Customs Service of Ukraine and systematized on the Energy Map portal.
IMPORTS
Oil and petroleum products (excluding crude) remained the largest import category, accounting for 61.9% of the total value of fuel and energy imports. Petroleum gases represented 17.2%, electricity 11.4%, and coal 6.2%, while all remaining commodity groups combined accounted for 3.3%.
Compared to the first half of 2025, the composition of the main import categories remained unchanged. However, the share of oil and petroleum products increased from 57.9% to 61.9%, while electricity nearly doubled its share from 5.7% to 11.4%. Meanwhile, the share of petroleum gases declined from 23.6% to 17.2%, and coal from 9.5% to 6.2%.
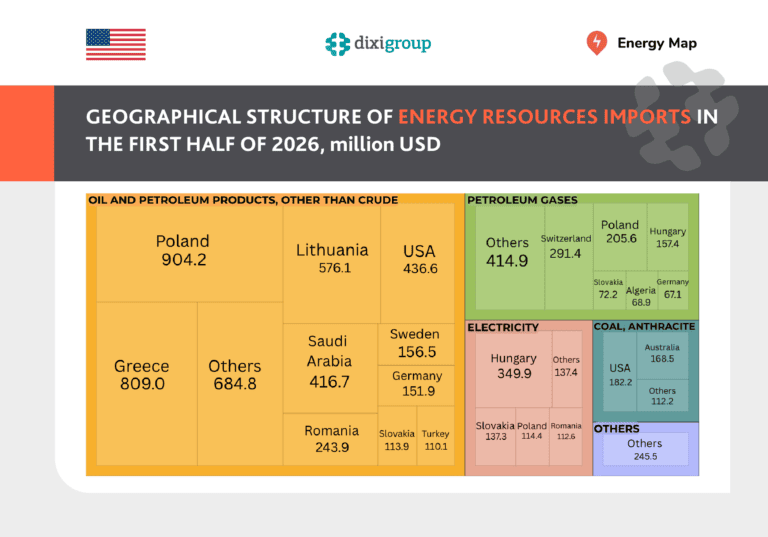
Imports of oil and petroleum products (excluding crude) increased by 63.5% in value to USD 4.6 billion, while import volumes grew by 28.7% to 4.5 million tonnes. The largest shares of imports originated from Poland (19.6%), Greece (17.6%), and Lithuania (12.5%).
Imports of petroleum gases reached USD 1.28 billion and 1.87 million tonnes, up 11.4% and 14.2%, respectively, compared to a year earlier. The largest shares by value were attributed to Switzerland** (22.8%), Poland (16.1%), and Hungary (12.3%). However, no physical deliveries of petroleum gases from Switzerland to Ukraine actually took place. Their appearance in customs statistics is explained by the methodology used to record foreign trade transactions.
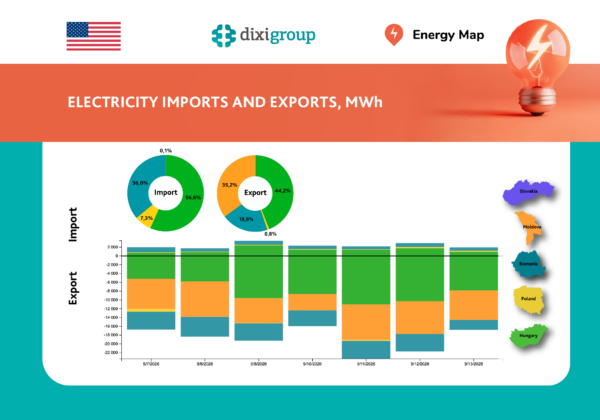
Electricity imports recorded the highest growth among the major commodity groups. Their value tripled to USD 851.58 million. Hungary accounted for 41.1% of electricity import expenditures, followed by Slovakia (16.1%), Poland (13.4%), Romania (13.2%), and Moldova (1.6%). Some import transactions are recorded under Serbia** and Belgium**, although no physical electricity flows originated from these countries, reflecting statistical accounting practices.
Since the State Customs Service does not publish physical electricity trade volumes, they can be estimated using ENTSO-E data. Between January and June 2026, Ukraine imported 4.35 million MWh of electricity, 3.4 times more than during the same period of 2025. The highest import volumes were recorded in the first quarter, when the consequences of russian attacks on energy infrastructure combined with adverse weather conditions created the greatest need for electricity imports.
Coal imports remained almost unchanged in value at USD 462.94 million, while import volumes increased by 18.4% to 2.34 million tonnes. The largest suppliers were the United States (39.4%), Australia (36.4%), Czechia (7.0%), Canada (6.9%), and Poland (6.4%).
The remaining nine categories of fuel and energy commodities accounted for USD 245.53 million, or 3.3% of the total value of imports.
EXPORTS
In the first half of 2026, Ukraine exported 11 categories of fuel and energy products to 80 countries, generating USD 293.63 million in export revenues.
Crude oil and crude petroleum products accounted for the largest share of export value (33.6%). Electricity represented 26.8%, oil and petroleum products (excluding crude) 15.2%, and petroleum gases 12.5%. The remaining commodity groups jointly accounted for 12.0% of exports. As in the previous year, no coal exports were recorded.
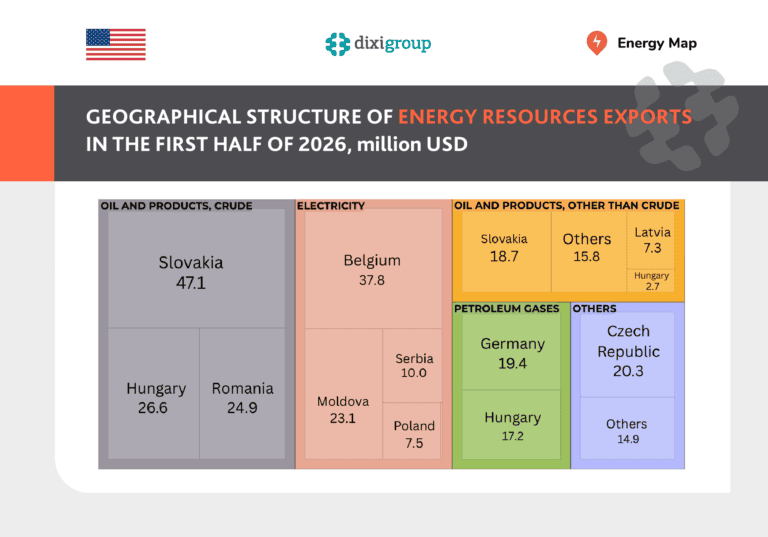
Exports of crude oil and petroleum products amounted to USD 98.59 million, with physical shipments totaling 165.05 thousand tonnes. Deliveries were made to Slovakia (47.7%), Hungary (27.0%), and Romania (25.3%). No exports of this commodity category were recorded during the corresponding period of 2025.
Electricity export revenues increased by 4.7% to USD 78.7 million. The largest shares of export value were recorded for Belgium (48.0%), Moldova (29.4%), Serbia (12.7%), and Poland (9.5%). According to ENTSO-E data, however, physical electricity exports declined 2.2-fold to 312.07 thousand MWh. This divergence between value and physical volumes indicates a substantial increase in the average export price of electricity.
It is worth noting that after electricity exports were completely suspended on 11 November 2025 following massive russian attacks on Ukraine’s energy infrastructure, cross-border exports resumed only on 5 March 2026.
Exports of oil and petroleum products (excluding crude) generated USD 44.52 million, more than doubling the figure recorded in the first half of 2025. Deliveries were made to 73 countries, with the largest buyers being Slovakia (41.9%), Latvia (16.3%), Hungary (6.2%), and Türkiye (4.2%).
Exports of petroleum gases increased from USD 0.92 million in the first half of 2025 to USD 36.62 million in the corresponding period of 2026. Export volumes rose from 1.22 thousand tonnes to 14.58 thousand tonnes. Virtually all exports were destined for Germany (53.0%) and Hungary (47.0%), while all other destinations combined accounted for less than 0.01%.
*The calculations include all goods classified under group 27 of the Ukrainian Classification of Goods for Foreign Economic Activity, including coal (groups 2701, 2702), oil and petroleum products (2709, 2710), gases (2711), electricity (2716), peat (2703), coke (2704), tars and oils (2706, 2707), pitch (2708), and other petroleum refining products (groups 2712–2715). Coal gas, water gas, and generator gas (group 2705) were not imported or exported in 2019-2026.
** Import statistics are compiled by country of origin; if unknown, by country of dispatch or trading country (country of the counterparty’s registration). Export statistics are compiled by country of destination; if unknown, by trading country. In external trade statistics, the partner country may reflect the trader’s jurisdiction (under the contract), rather than the actual country of origin, dispatch, or destination.
The Energy Sector Transparency (EST) project supports key U.S. administration priorities by advancing its energy interests and expanding opportunities for American companies in Ukraine’s energy sector. By strengthening transparency and anti-corruption safeguards, the project helps foster a more predictable, rules-based environment that can support fair competition and encourage investment. Through support for market-oriented reforms and stronger data systems, EST contributes to U.S. economic interests while reinforcing U.S. leadership in the global energy sector.
This report is made possible by the generous support of the United States Government. The contents are the responsibility of DiXi Group and do not necessarily reflect the views of the United States Government.