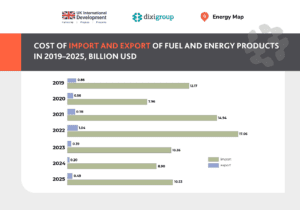
According to Energy Map data, in 2025 Ukraine imported 15 types of fuel and energy products* from 69 countries, totaling $10.5 billion. This is $1.6 billion, or 18.3%, more than in 2024. Export revenues increased 2.4 times-from $0.2 billion to $0.5 billion.
Import expenditures exceeded export revenues by 21.4 times, while the negative balance of foreign trade in energy products grew to over $10 billion in 2025, confirming the country’s energy deficit.
IMPORTS
In the structure of imports, the largest share in monetary terms was held by oil and petroleum products (excluding crude), accounting for 62.8%. Smaller shares were attributed to petroleum gases (18.3%), coal (9.6%), and electricity (5.5%). Other fuel and energy resources, including coal and oil processing products, accounted for 3.8%.
For comparison, in 2024 oil and petroleum products accounted for 76.6%, while petroleum gases and electricity each made up 7.5%, and coal 4.5%. Before the full-scale war, in 2021, the structure was significantly different: oil and petroleum products accounted for 37.6%, petroleum gases 33.4%, coal 16.7%, and electricity only 0.6%.
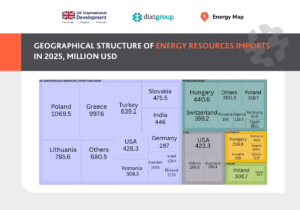
Imports of oil and petroleum products (excluding crude) in 2025 amounted to 8.2 million tonnes worth $6.6 billion, which is $0.2 billion less than in 2024. The main exporting countries remained Poland (16.2% of expenditures), Greece (15.1%), Lithuania (11.9%), and Türkiye (9.7%). In total, these energy resources were imported from 52 countries.
Spending on petroleum gas imports nearly tripled to $1.9 billion, with total volumes reaching 2.8 million tonnes. The main suppliers were Hungary (22.9% of expenditures), Switzerland** (18.7%), and Poland (16.5%). Another 34 countries accounted for shares not exceeding 8% each. In 2024, 45.7% of petroleum gases were supplied from Poland, Algeria, and Lithuania.
It should be noted that there are no physical deliveries of petroleum gases from Switzerland to Ukraine; their inclusion in the statistics is due to accounting specifics of import reporting.
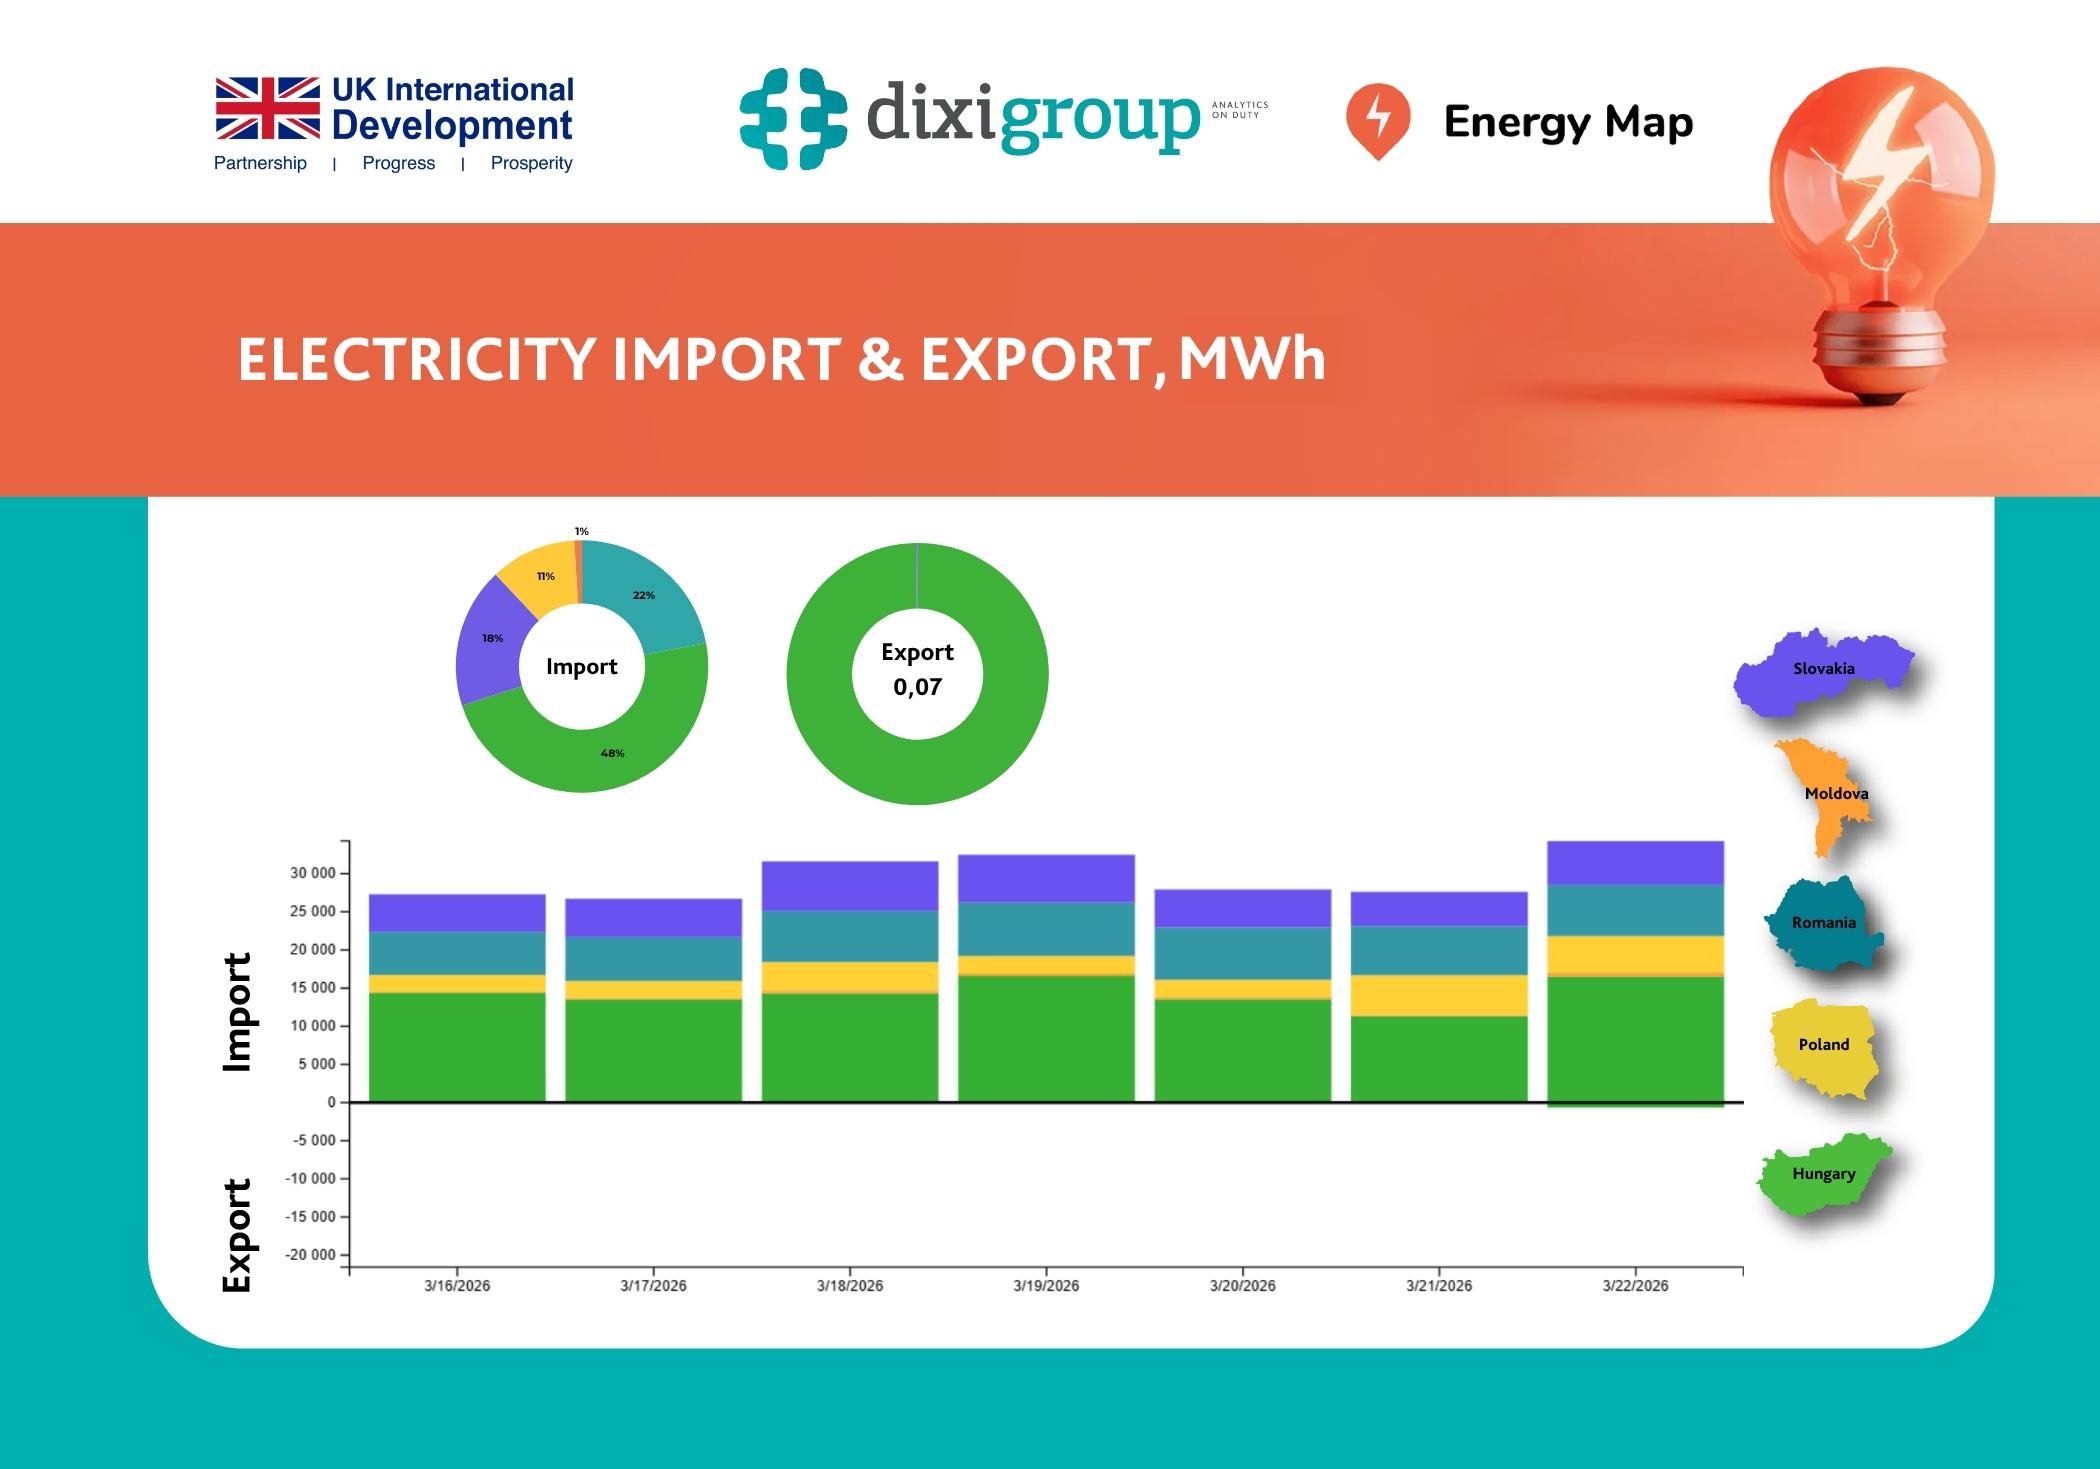
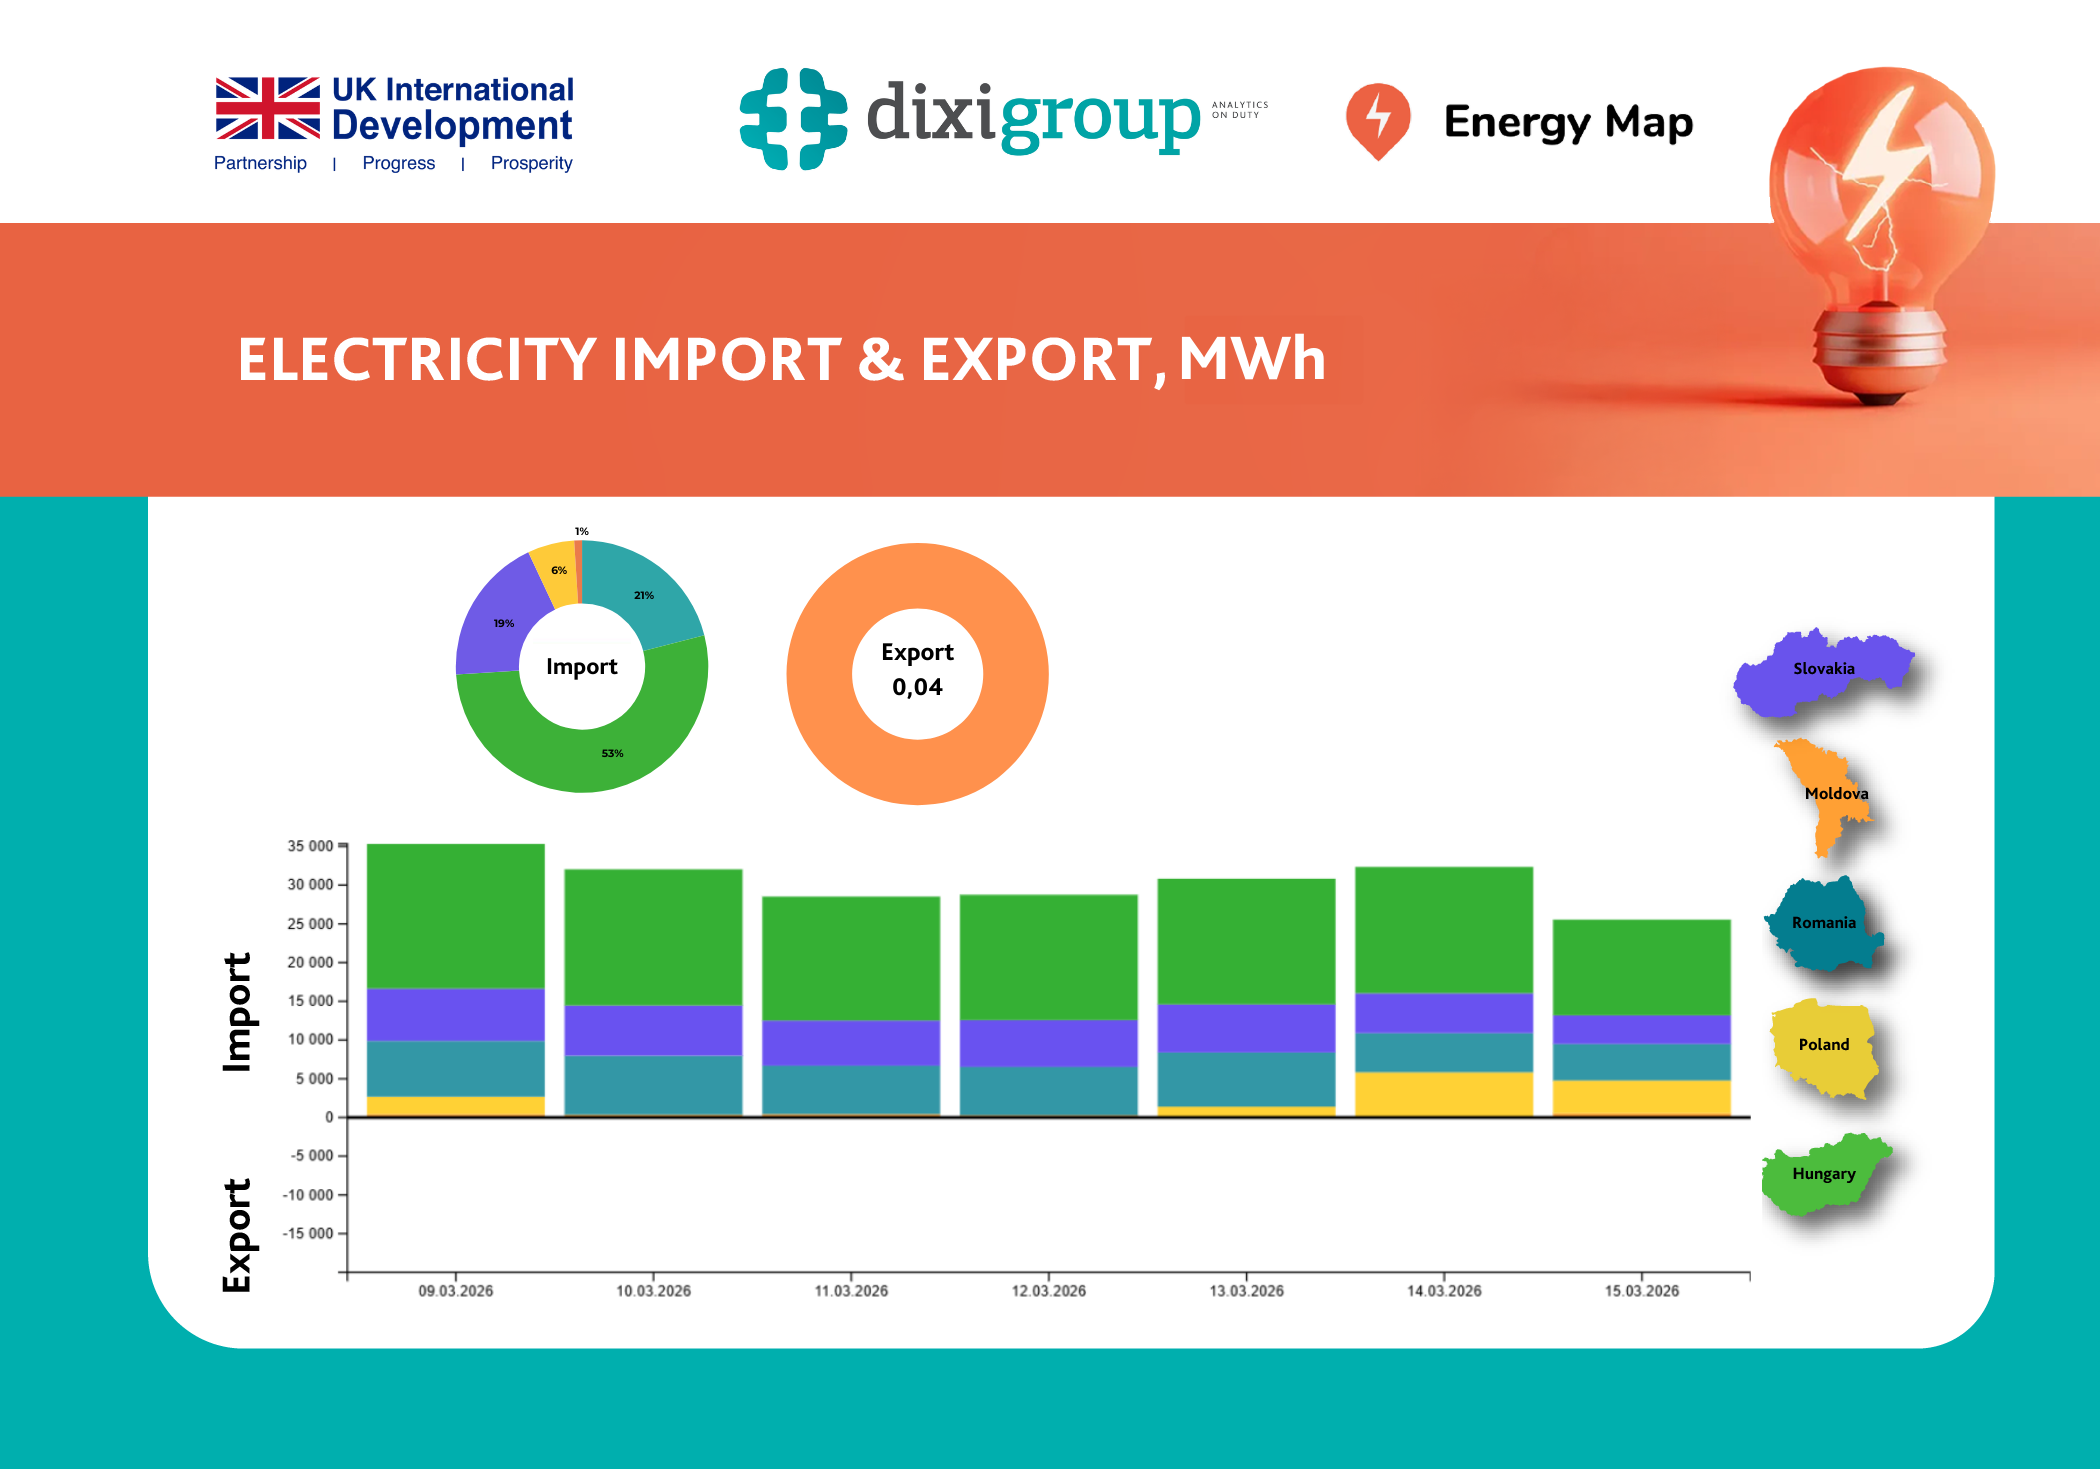
Electricity import expenditures decreased by 13.3% to $580.5 million. The largest share of these expenditures was for electricity imported from Hungary (37.7%). Smaller shares were attributed to Slovakia (18.6%), Romania (15.7%), Poland (15.5%), and Moldova (4.1%). Another 8.4% was attributed to Belgium** (no physical deliveries; explained by statistical accounting specifics).
It is important to note that the State Customs Service does not provide data on physical volumes of electricity trade. According to ENTSO-E platform data, Ukraine imported 3,354.3 GWh in 2025, which is 24.4% less than in 2024.
Coal import expenditures increased 2.5 times to $1.0 billion, with 4.5 million tonnes purchased. Before the full-scale war, Ukraine imported significantly larger volumes of coal. For comparison, in 2021 imports reached 19.6 million tonnes worth $2.5 billion, meaning physical volumes have decreased by 4.3 times. This decline is due to reduced coal consumption by key consumers-thermal power plants and combined heat and power plants-caused by large-scale destruction of energy infrastructure by Russia.
The largest shares of coal imports in 2025 came from the United States (42.1%), Australia (28.4%), Poland (10.0%), the Czech Republic (8.8%), and Canada (6.4%). Another nine countries together accounted for 4.3%. Compared to 2024, the share of the United States increased significantly (+17.5 percentage points), reaching 24.6%.
In 2025, the largest amount of funds was directed to Poland-$1.9 billion, or 17.9% of total energy import expenditures, of which $1.1 billion was spent on oil and petroleum products (excluding crude). Greece ranked second with $1.0 billion (9.6%), with 98.6% of this amount also spent on oil and petroleum products. Shares of expenditures for imports from the United States accounted for 8.8%, Lithuania 8.3%, and Slovakia 7.0%. The remaining 64 countries accounted for 48.4% of total spending.
EXPORTS
In 2025, Ukraine exported 12 types of fuel and energy products to 92 countries, generating $491.1 million in revenue.
The largest share of revenues came from electricity exports (57.6%). Oil and petroleum products also accounted for significant shares: 16.4% crude and 12.6% non-crude. Other fuel and energy products made up 13.4% of total revenues. Coal exports were not carried out in 2025, whereas in 2024 they accounted for 18.1% of annual export revenues.
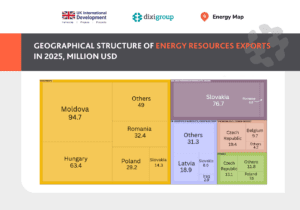
Revenue from electricity exports increased 3.5 times to $283.1 million. The largest shares came from Moldova (33.5%) and Hungary (22.4%), followed by Belgium** (17.3%), Romania (11.5%), Poland (10.3%), and Slovakia (5.1%).
Electricity exports grew from June to September 2025, when attacks on generation facilities were less intense. Starting in October, russia intensified attacks on the energy sector, and from November 11 Ukraine was forced to completely halt electricity exports. This marks the third consecutive year in which Ukraine has had a negative balance in electricity trade due to the war and destruction of energy infrastructure.
According to ENTSO-E data, Ukraine exported 2,143.2 GWh of electricity in 2025, which is more than six times higher than in 2024.
Exports of crude oil and petroleum products generated $80.5 million, mainly from Slovakia (95.2%) and Romania (4.8%). The total physical volume amounted to 180.6 thousand tonnes, whereas no exports in this category were recorded in 2024.
Exports of non-crude oil and petroleum products generated $61.6 million and were supplied to 87 countries. The main buyers were Latvia (30.6%), Slovakia (13.9%), Iraq (4.7%), Ghana (4.3%), and Türkiye (4.1%).
The largest export revenues in 2025 came from Slovakia-$100.3 million, or 20.4% of total income (including $76.7 million from crude oil and petroleum products and $14.3 million from electricity). Moldova accounted for $97.6 million (19.9%), of which $94.7 million came from electricity exports. Shares of export revenues from Hungary amounted to 13.7%, Belgium 11.9%, and Poland 7.9%. The remaining 87 countries accounted for 26.2% of total export revenues.
*The calculations include all goods classified under group 27 of the Ukrainian Classification of Goods for Foreign Economic Activity, including coal (groups 2701, 2702), oil and petroleum products (2709, 2710), gases (2711), electricity (2716), peat (2703), coke (2704), tars and oils (2706, 2707), pitch (2708), and other petroleum refining products (groups 2712–2715). Coal gas, water gas, and generator gas (group 2705) were not imported or exported in 2019-2025.
** Import statistics are compiled by country of origin; if unknown, by country of dispatch or trading country (country of the counterparty’s registration). Export statistics are compiled by country of destination; if unknown, by trading country. In external trade statistics, the partner country may reflect the trader’s jurisdiction (under the contract), rather than the actual country of origin, dispatch, or destination.
The publication was prepared with the financial support of the UK Agency for International Development under the project “Mainstreaming National Energy and Climate Plan for Ukraine’s Green Recovery and Strengthening the Green Transition Office” implemented by DIXI GROUP NGO. The contents of the publication are the sole responsibility of DIXI GROUP NGO and under no circumstances can be considered to reflect the position of the UK Agency for International Development.