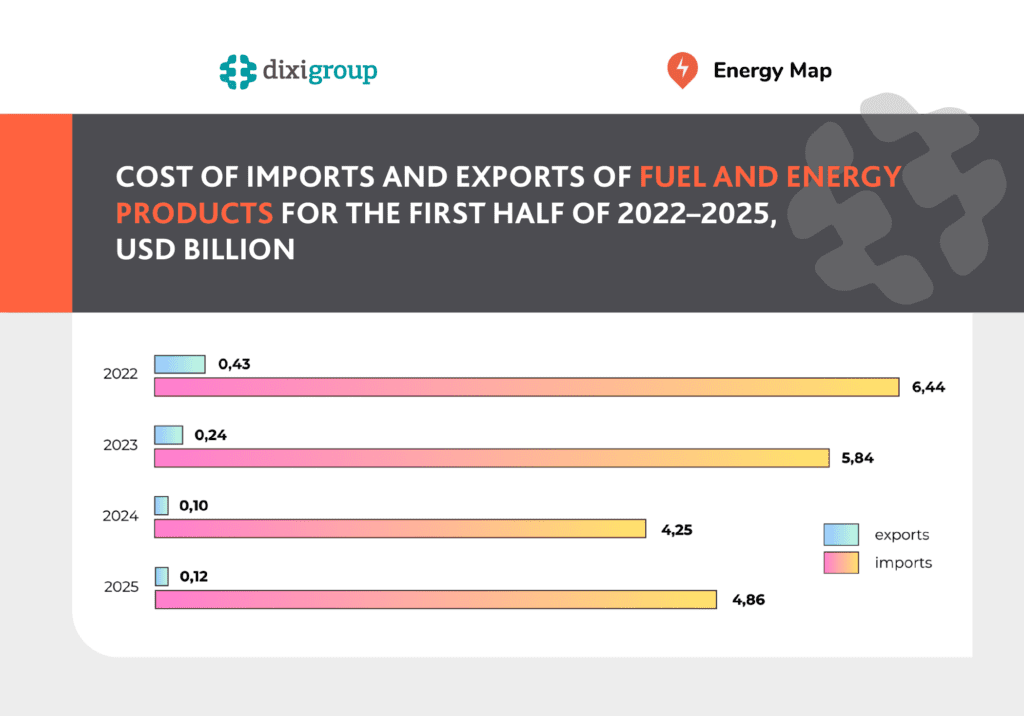
According to Energy Map data, in the first half of 2025, Ukraine imported energy resources worth $4.86 billion, while export revenues reached only $0.12 billion. Compared to the same period in 2024, import costs increased by 14.4%, and export revenues grew by 20.6%. Despite the revenue growth, the country remains energy-deficient, as import expenditures are 40 times higher than export earnings.
For comparison, in pre-war 2021, every dollar of export corresponded to $19 of imports, with an annual trade balance of -$14.15 billion. In the first half of 2025, the gap widened: every dollar of export was matched by $40 of imports, and the trade balance reached -$4.74 billion.
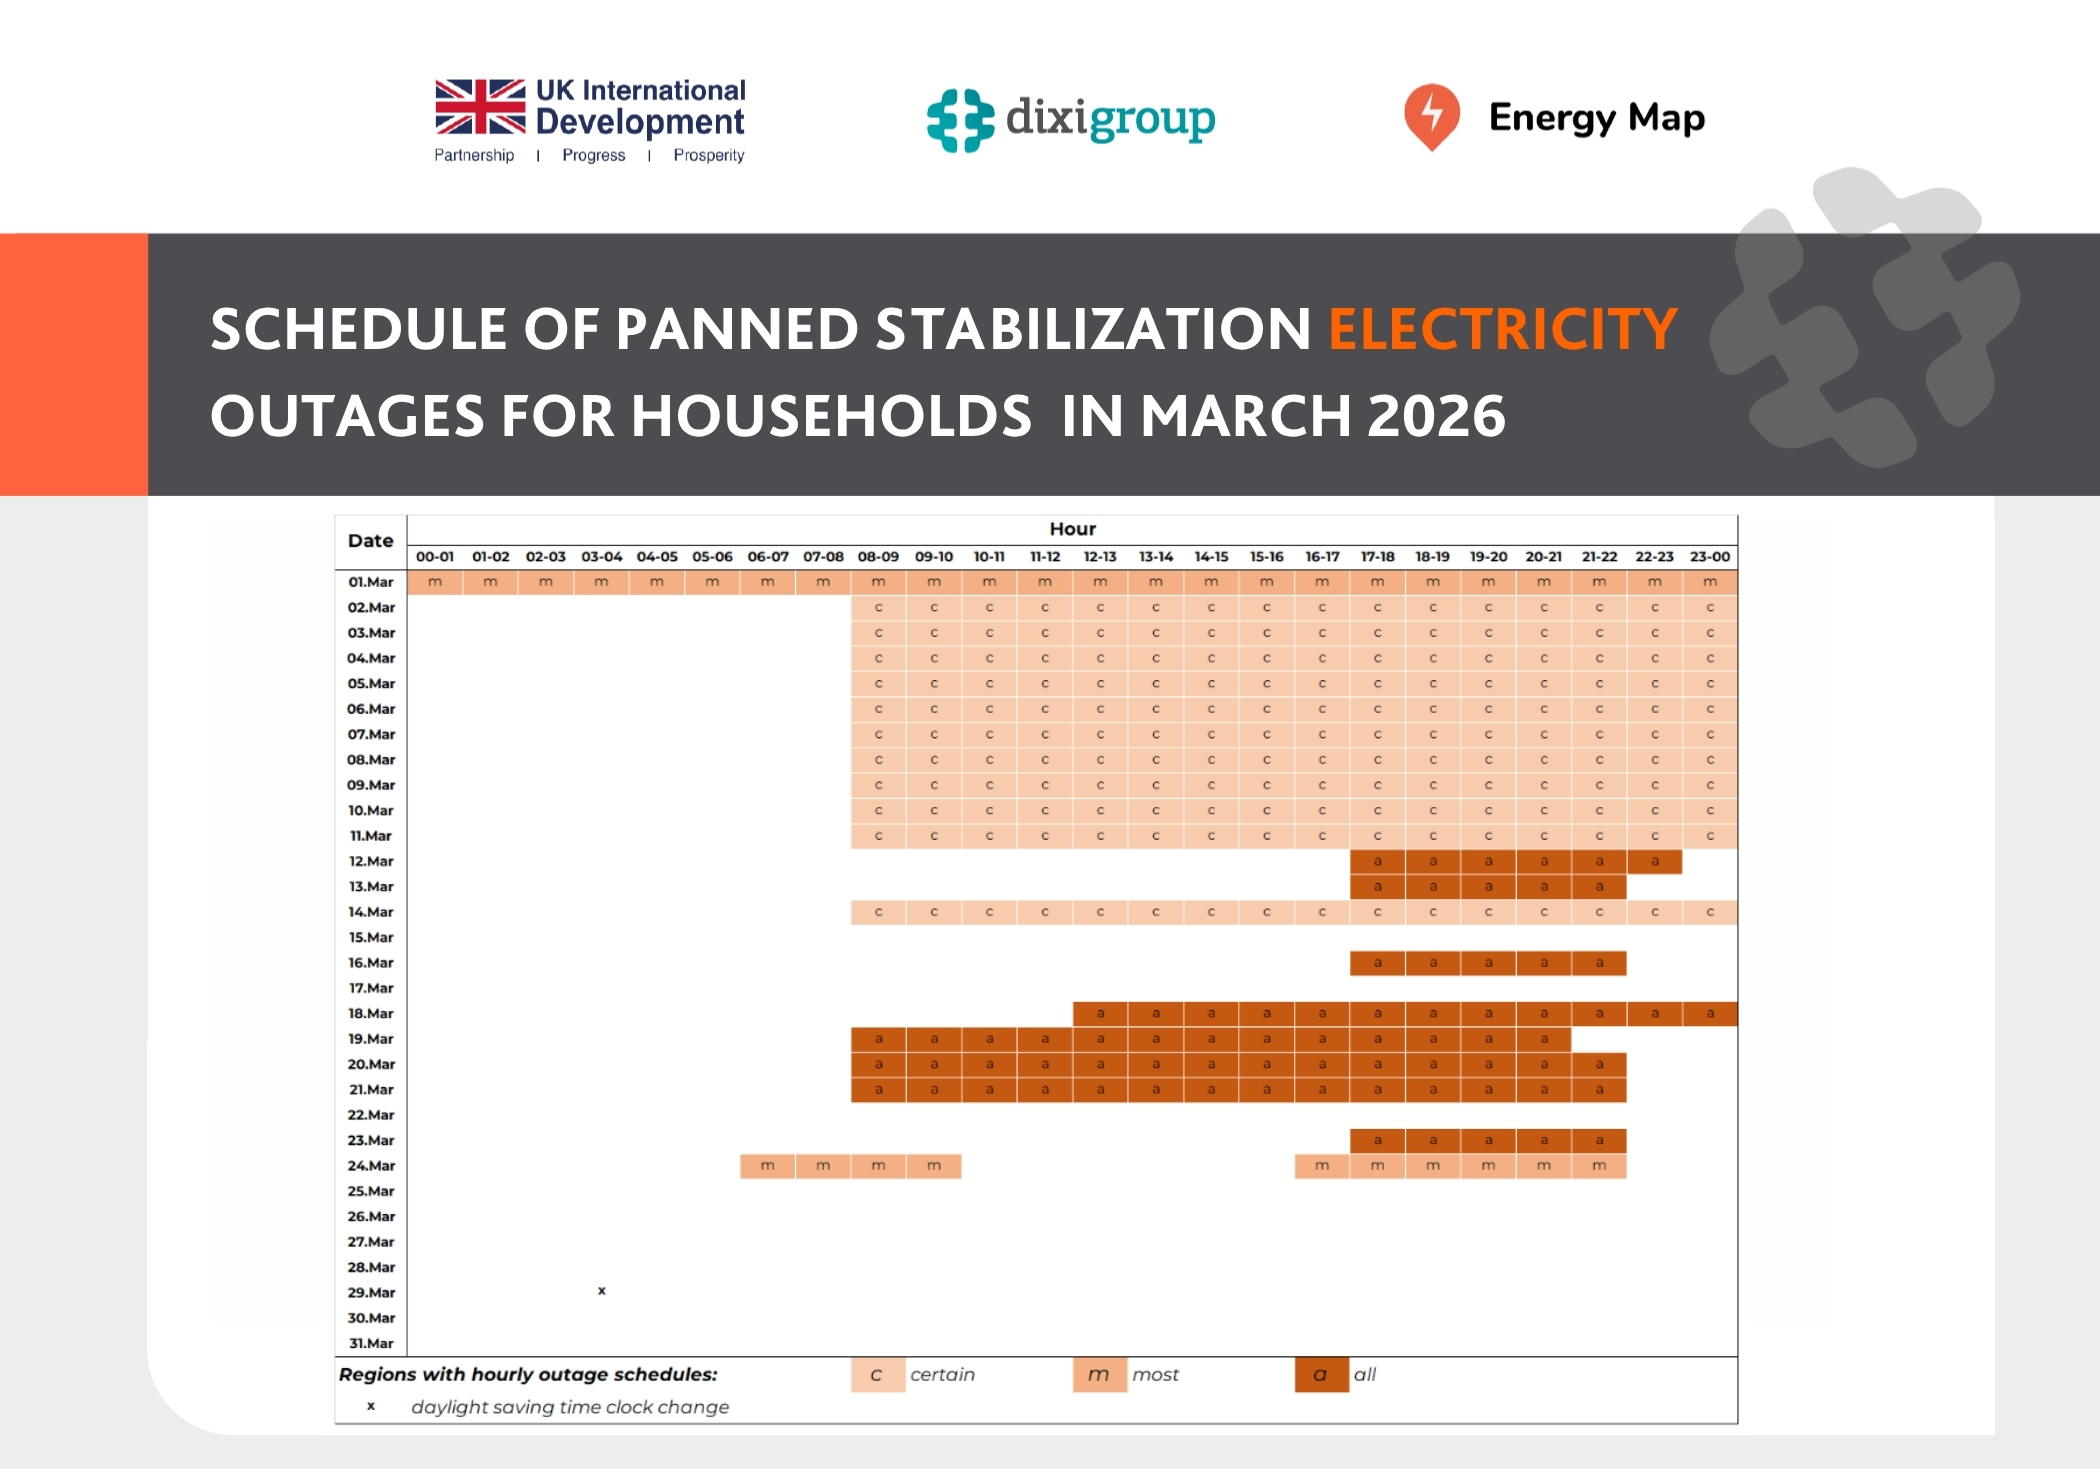
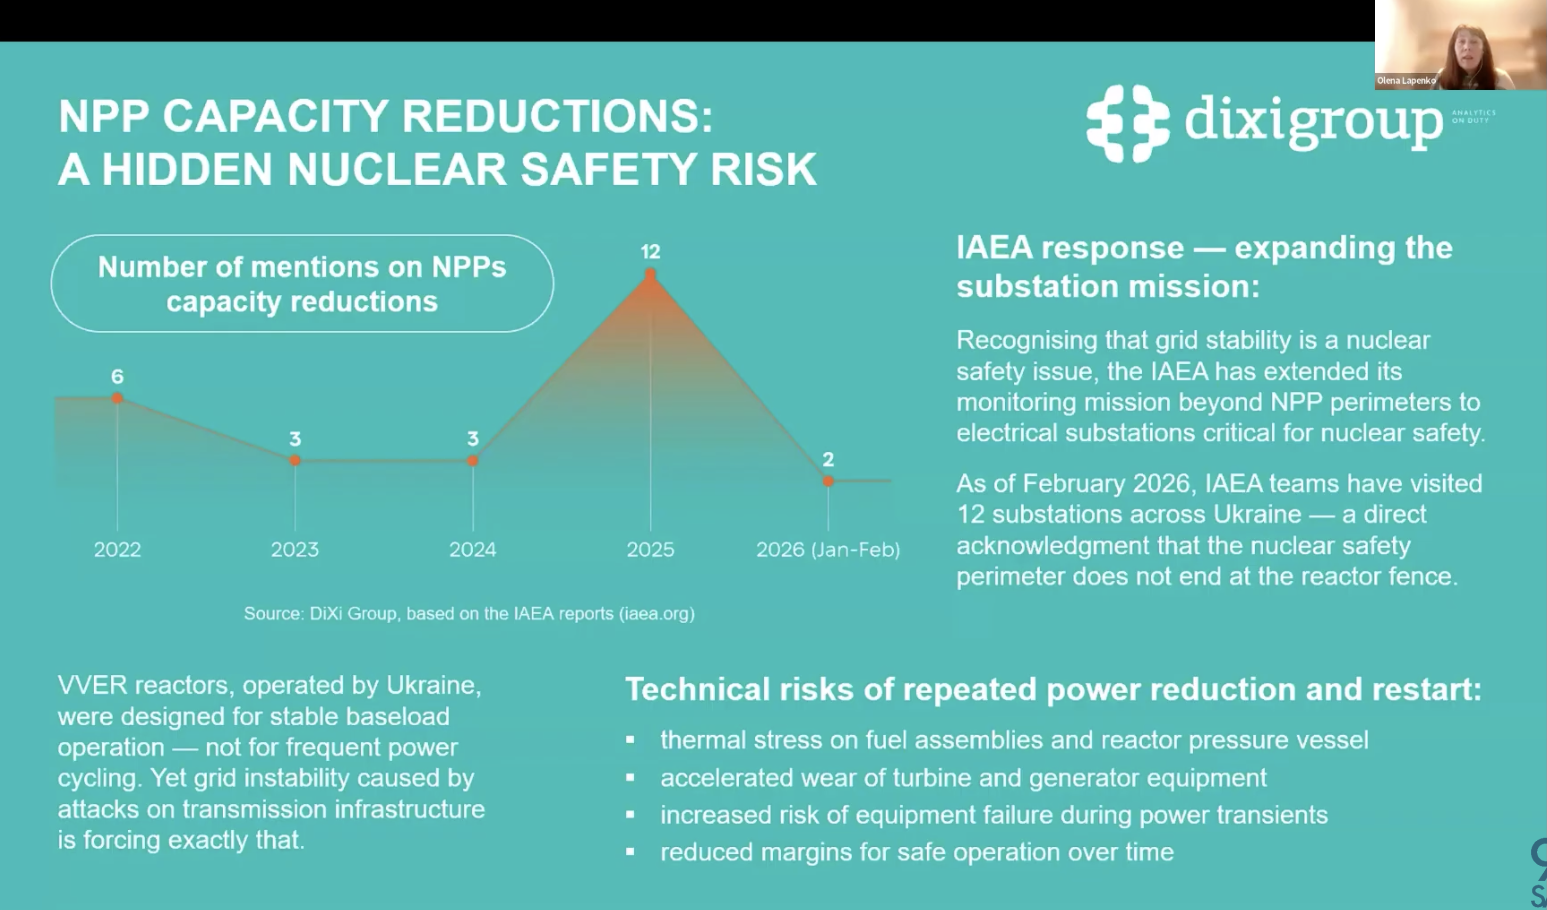
The ongoing war and systematic Russian attacks on energy infrastructure continue to adversely affect Ukraine’s energy trade balance. In 2024, attacks on generation facilities and key transmission nodes forced an increase in electricity imports. In 2025, import demand declined, but prices remained high due to limited domestic reserves and the European market context. Simultaneously, strikes on gas infrastructure caused a sharp decline in domestic production in 2025, causing greater withdrawals from underground storage and urgent imports to avoid outages.
Additionally, the government continues to restrict exports: the quota for Ukrainian natural gas remains zero, while limits are set for coking coal (1.3 million tons) and fuel oil (0.4 million tons).
Import Structure
In January-June 2025, imports were mainly composed of:
- oil and petroleum products (excluding crude ones) – 57.9% of total import costs;
- petroleum gases and other gaseous hydrocarbons – 23.6%;
- hard coal – 9.5%;
- electricity – 5.7%;
- other ten energy resource groups, including coke, bitumen, peat, resins, oils, and other petroleum products – together 3.3% of import costs.
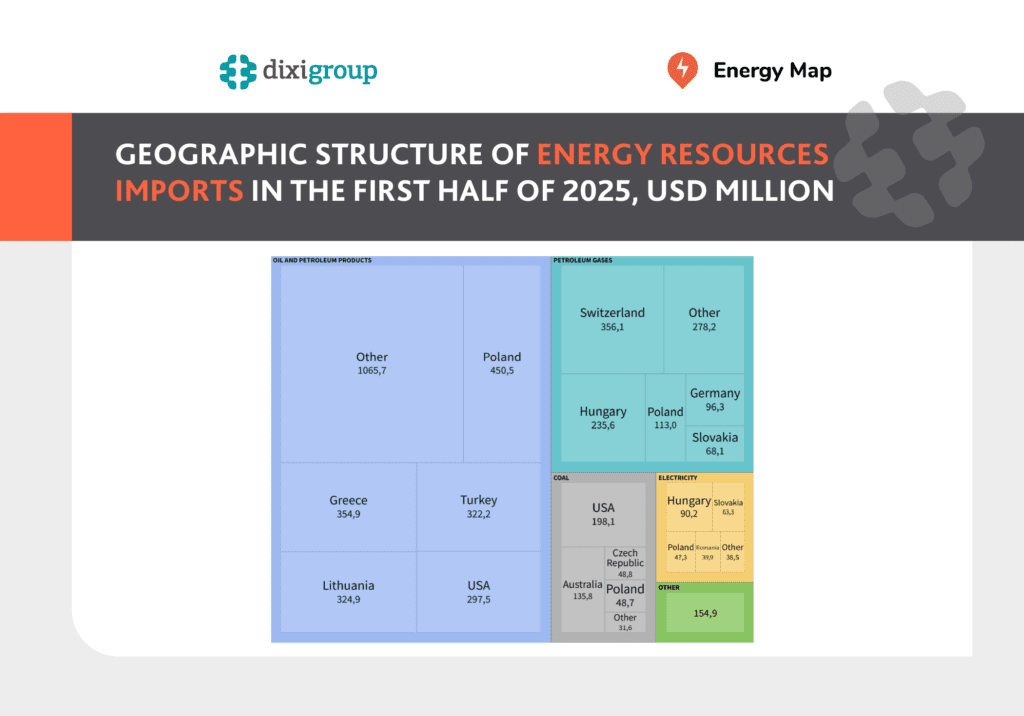
Oil and petroleum products, including diesel, gasoline, lubricants, and other refined products, imports decreased by 16.6% ($0.56 billion) compared to the first six months of 2024, totaling $2.82 billion. Ukraine imported 3.49 million tons, with the main suppliers being Poland (15.3% of the total amount), Greece (13.6%), Turkey (12.2%), Lithuania (11.9%), and the USA (10.7%).
In contrast, expenditures on petroleum gases (primarily natural gas, propane, butane, and other hydrocarbons) rose sharply. In the first six months of 2025, Ukraine spent $1.15 billion, nearly four times the level of the first half of 2024, importing 1.64 million tons. The largest suppliers were Switzerland (30.3% of the volume), Hungary (20.3%), and Poland (10.0%), with the remaining 26 countries each contributing less than 10%.
Ukraine spent $0.46 billion for hard coal, up from $0.21 billion in mid-year 2024, nearly doubling purchases from 1.06 million tons to 1.98 million tons. Imports came from 11 countries, led by the USA (38.6% of the total amount), Australia (27.9%), Poland (12.7%), and the Czech Republic (11.3%).
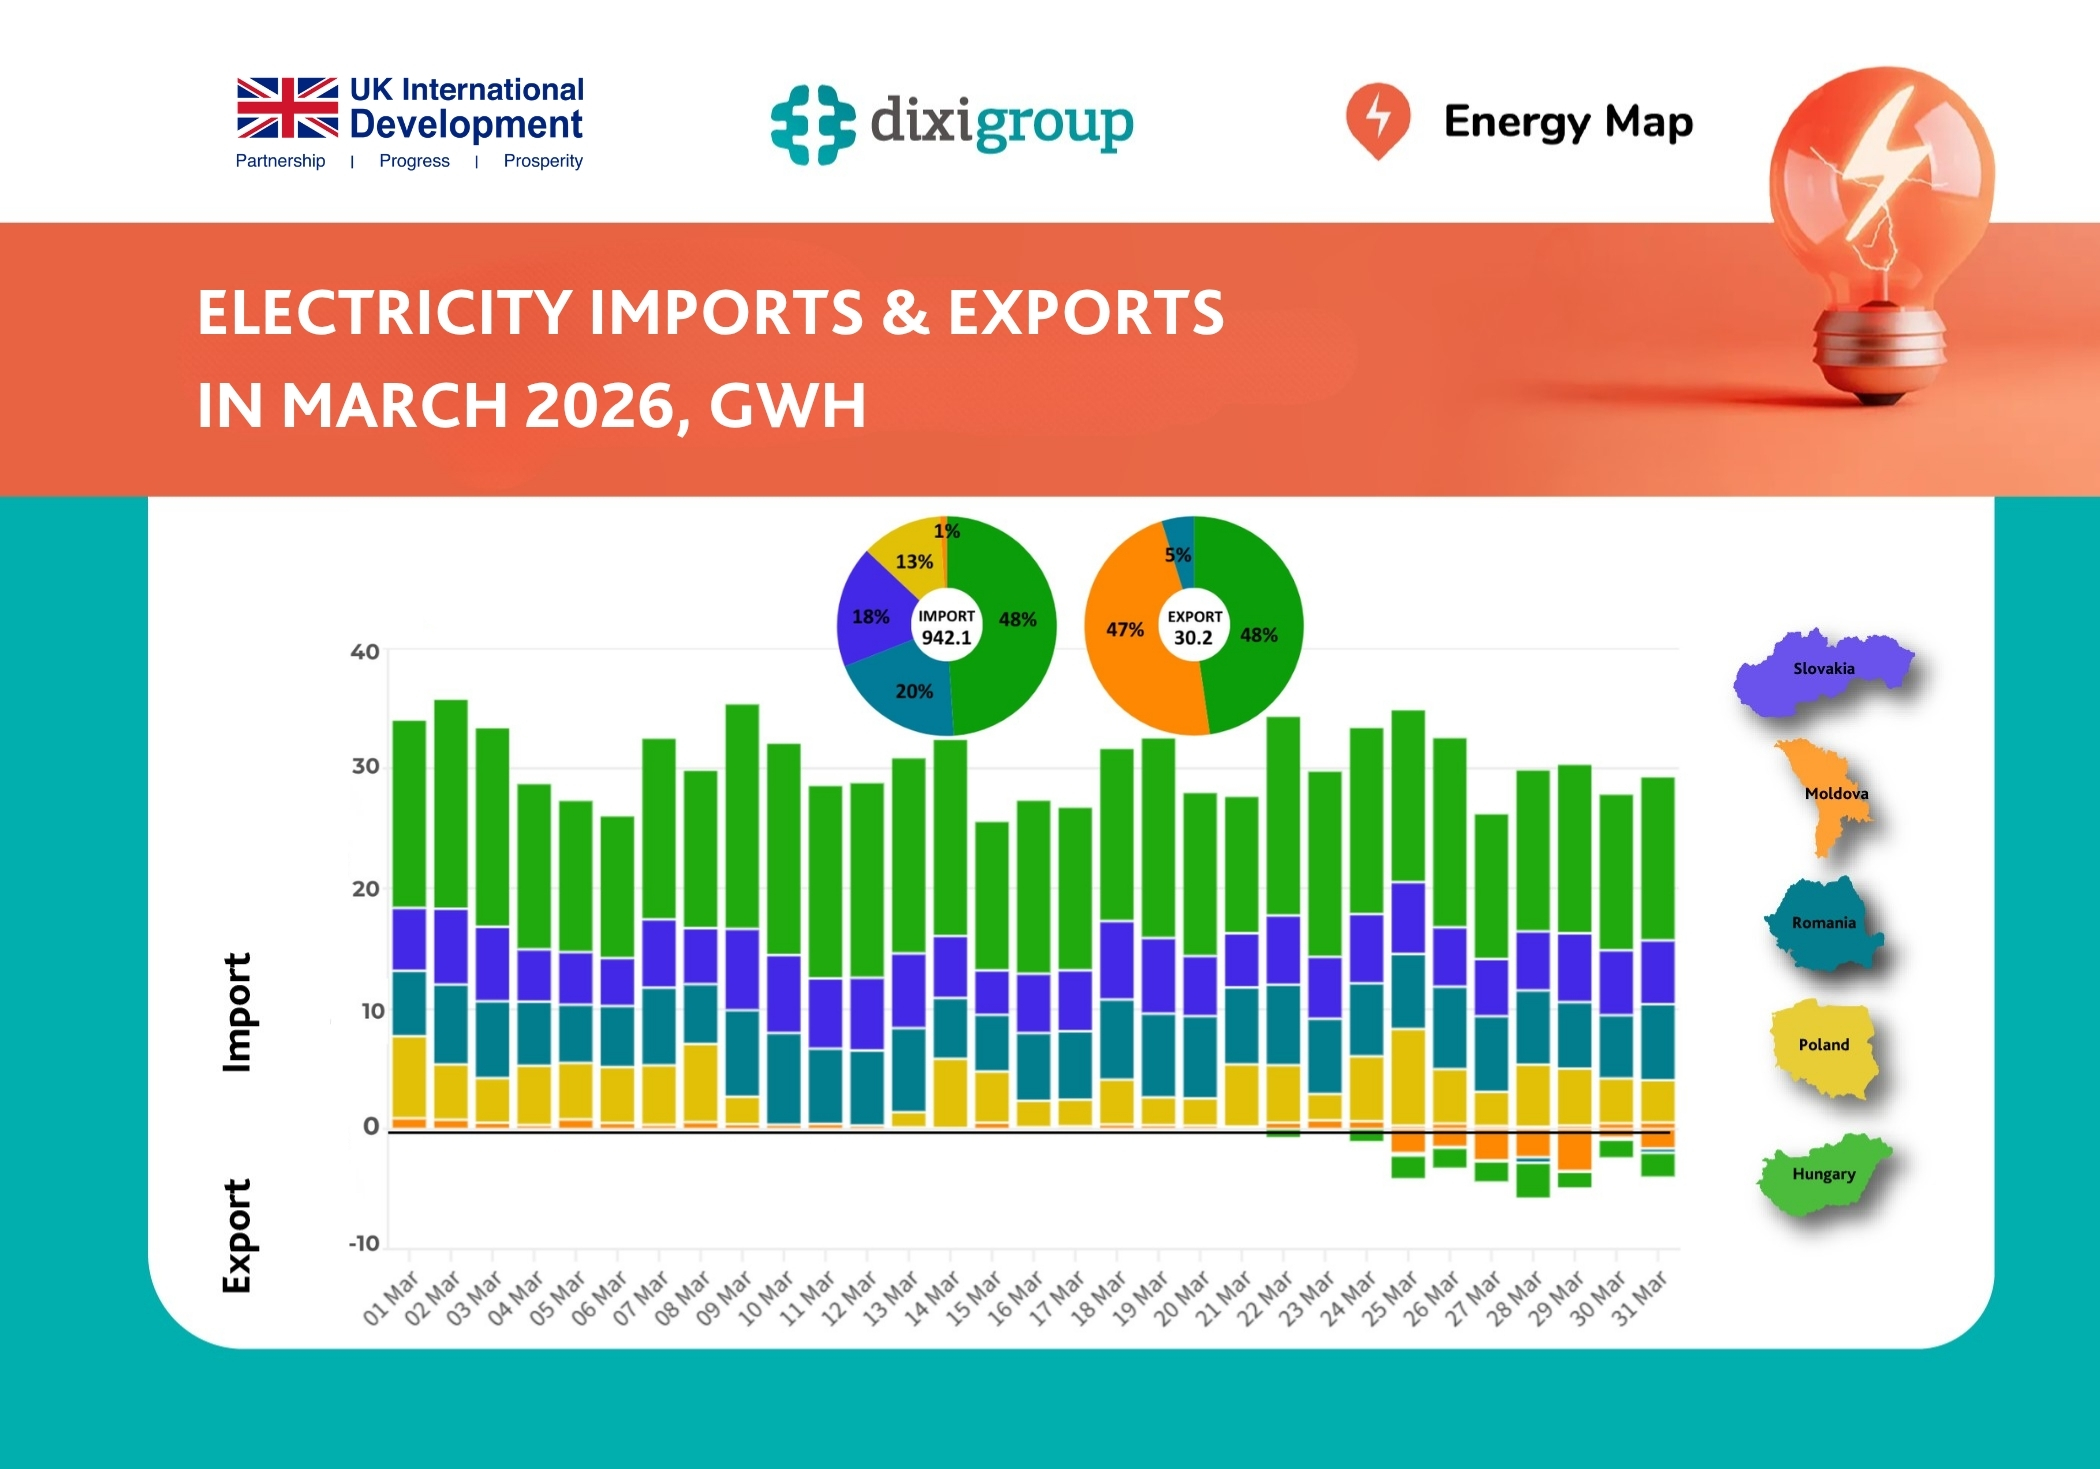
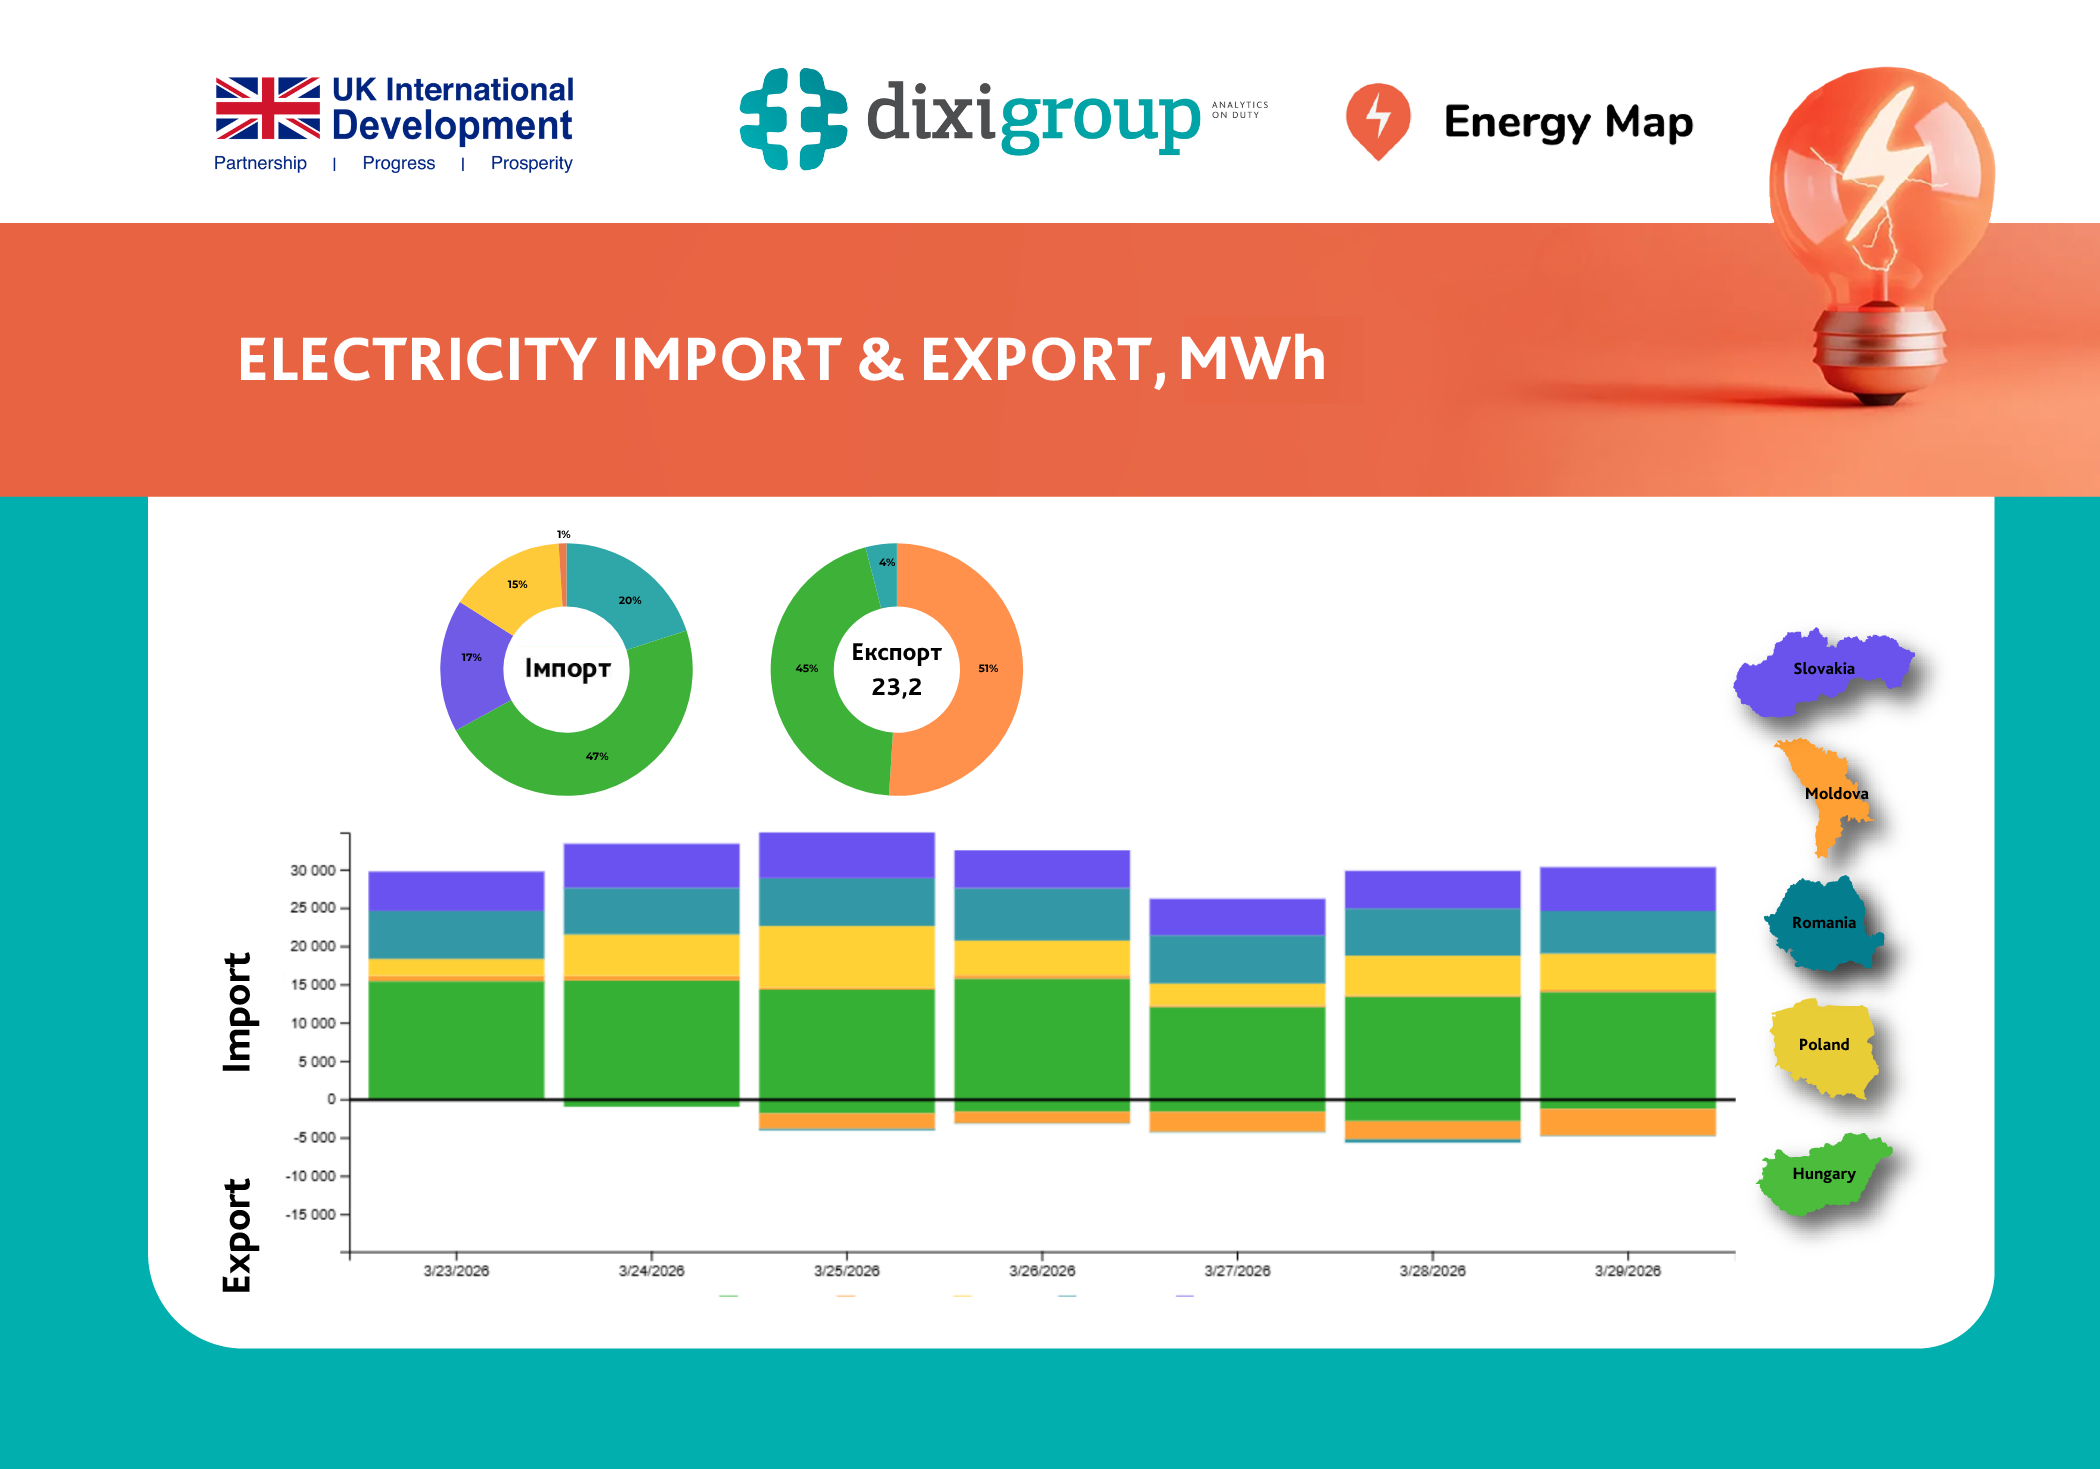
Electricity imports rose by 48% to $0.28 billion, compared to $0.19 billion a year earlier, indicating higher prices despite lower physical volumes. Major resources were imported from Hungary (32.3% of expenditures), Slovakia (22.7%), and Poland (17.0%).
Export Structure
Fuel and energy exports in the first half of 2025 generated $122.4 million, reaching 71 countries.
Key export commodities:
- electricity – 61.4% of total export revenue;
- oil and petroleum products (excluding crude ones) – 18.1%;
- coal and peat resins – 12.3%;
- other fuel and energy products, including peat, coke, petroleum gases, bituminous mixtures, and other refined products – 8.2%.
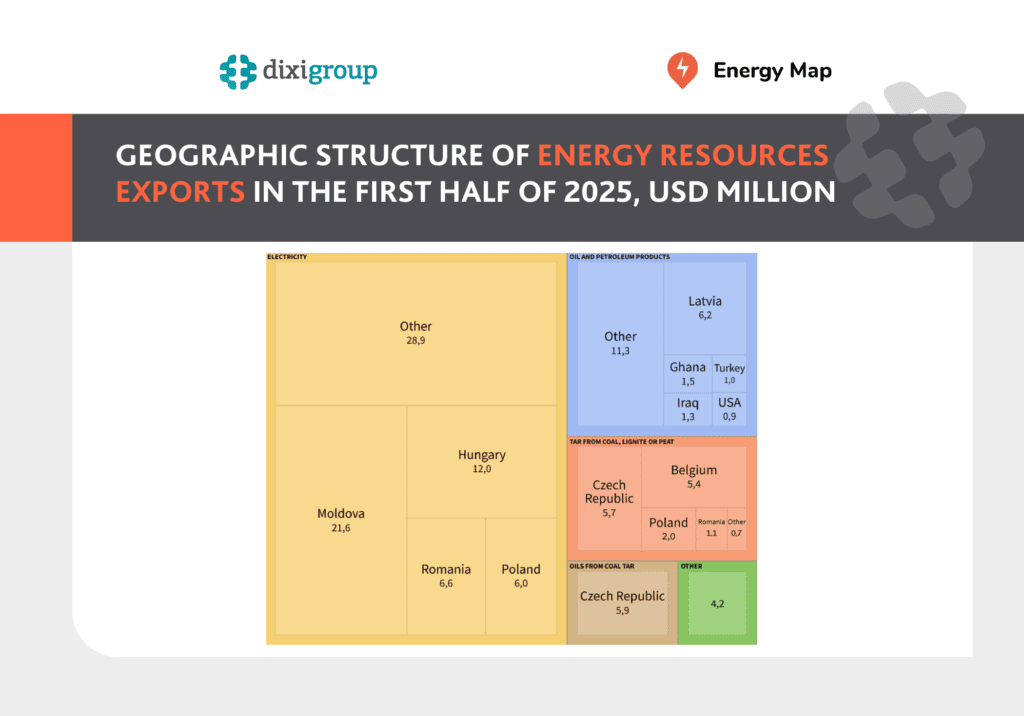
Electricity exports grew significantly to $75.1 million (+103.9% vs. first half of 2024). The largest share of revenue came from Belgium (33.0%), Moldova (28.8%) and Hungary (16.0%). The Belgium share reflects a contractual arrangement – electricity was not physically delivered there but sold under a contract with a company registered in the country.
Exports of oil and petroleum products brought in $22.2 million, which is $8.6 million more than last year. A total of 18.4 thousand tonnes of products were exported, with more than 65% shipped to Latvia. The other 65 countries had a share of less than 4%.
Sales of 35.4 thousand tons of coal and peat resins yielded $15.0 million, with over 95% of revenue from Belgium, Czechia, Poland, and Romania. Compared to the same period in 2024, revenues fell by 17.4%, and volumes by 13.4 thousand tons.
For 2025, the Ukrainian government set a zero export quota for natural gas of Ukrainian origin, along with restrictions on exporting coking coal (1.3 million tons) and fuel oil (0.4 million tons). Similar restrictions have been in place since the full-scale war began; in previous years, gas quotas were also zero, while coal and fuel oil limits varied annually.
*The calculations include all goods classified under group 27 of the Ukrainian Classification of Goods for Foreign Economic Activity, including coal (groups 2701, 2702), oil and petroleum products (2709, 2710), gases (2711), electricity (2716), peat (2703), coke (2704), tars and oils (2706, 2707), pitch (2708), and other petroleum refining products (groups 2712–2715). Coal gas, water gas, and generator gas (group 2705) were not imported or exported in 2022-2025.
The original material is on our Energy Map resource – here.